Does the math of doubling of stocks every ten years still work?
Posted on January 27, 2023
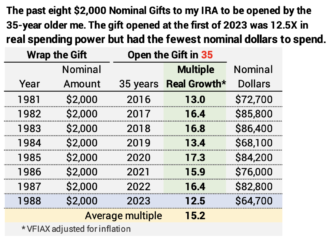
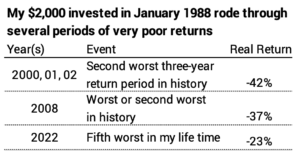
The math that uses the long-run average of 7.1% annual real return for stocks says stocks should double in real spending power roughly every ten years. 2022 was the fifth worst return year for stocks in my life time: decline of -23% real return. Does this mean that the amount of money I saved and invested solely in stocks decades ago failed to double every decade? NO! If one looks at a 35-year holding period, I would expect 3½ doublings or 12 times more in spending power. The money that I put into my IRA in very early January 1988 grew 12.5 times in real spending power by the end of 2022.
== Stocks ~7.1% real return rate ==
I added 2022 results to the graph that shows real returns for stocks and bonds since 1926. I use 7.1% as the long-run average real annual return rate for stocks and 2.4% for bonds. The graph this year shows the sharp decline for stocks and the sharp decline for bonds. You can see this graph more clearly in this .pdf file.
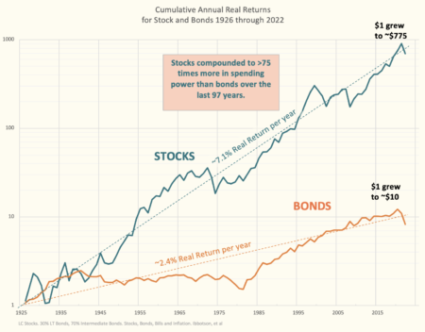
The slope of the line for 2022 for stocks reflects the -23% real decline; that was the fifth steepest decline in my lifetime. The slope of the line for bonds reflects a -25% real decline; this is the steepest one-year decline on this graph. It follows last year’s decline; the two-year decline is clearly the worst in history.
== Looking back: the picture ==
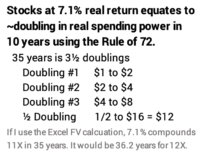
Every January I look back to calculate how much my contribution to my retirement plan grew over 35 years. (In prior years I’ve used 36 years: here is last year’s example; I’m focusing on 35 years in this post.) I use the Rule of 72 to estimate that stocks double in real spending power every decade. Thirty-five years is 3½ doublings. Three doublings is 8X (1 to 2; 2 to 4; 4 to 8) and the last five years is halfway to 16 or 12. Did the -23% real return for stocks in 2022 ruin that math? NO!
I get a visual answer to the question for any number of years by drawing a straight line on the graph of cumulative returns between the two years. For the most recent 35 years, I’d draw a line that connects the start of 1988 to the end of 2022 and compare the slope of that line to the slope of 7.1% annual return.
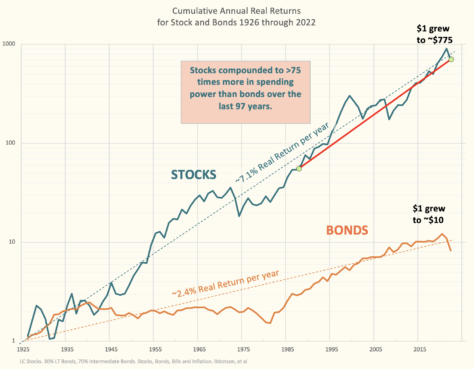
The slope of the red line I’ve drawn is slightly steeper than the slope of the 7.1% line. Therefore, my average annual return rate over the past 35 year is slightly greater than 7.1%. I should calculate to a bit more than 12X more in real spending power for my initial investment.
== Looking back: the data ==
The detailed way to understand my cumulative return is use the actual data that I show in this table. I can get the cumulative return data for an investment for any period of time from the Morningstar site. I use the return for the stock index fund VFAIX for the S&P 500 index; this is the original stock index fund; I know my investments in my IRA over many at least matched the cumulative return for VFIAX. I adjust the nominal growth I get from the Morningstar chart by inflation to find my investment at the start of 1988 grew 12.5 times in real spending power.
All my contributions to my IRA since 1981 grew at least 12 times in real spending power in 35 years. If you look at the graph, the starting point for each year was well below the dotted line for 7.1% and ended much closer to or above the dotted line. All my past 35-year lines have been steeper than the 7.1% line. That will likely last a few more years, since the starting point of each line will be below the line for 7.1% return rate.
My $2,000 invested in 1988 successfully rode through several periods of very poor returns:
== This 35-year period was really the worst ==
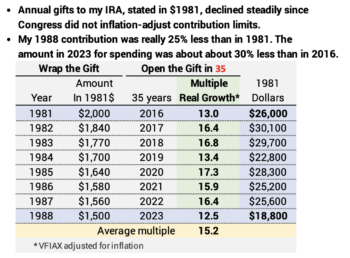
The 35-year period ending this year was really the worst relative to a $2,000 contribution to my IRA in all years 1981-1988. That’s because contribution limits to IRAs did not annually adjust for inflation; I think Congress has to pass an Act to adjust the limits, and they did not do that for many years in the 1980s. My nominal $2,000 gift in January 1988 was really 25% less than the amount I contributed January 2000. Even though the multiple in real growth was about the same I had about 30% less in spending power for 2023 as compared to 2016.
My employer in the early 1980s did not have a defined contribution pension plan, but my employer in the mid-1980s did. I know I contributed a percentage of pay – particularly to earn my employer’s match. I’m pretty sure my contributions to my employer’s plan + my IRA increased in real terms over this period.
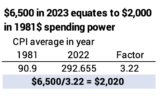
== $6,500 this year matches my initial $2,000 ==
Congress now fairly regularly adjusts the contribution limits to IRAs for inflation. The contribution limit for 2023 is $6,500 up $500 or 8% from last year. When I adjust for inflation, that $6,500 is almost identical to my initial contribution in 1981.
Conclusion. The long-term real return rate for stocks means the stock have doubled in real spending power every ten years. There have been periods of wide variation from this rule of thumb. Did the -23% real decline for stocks in 2022 mean my past investments did not match the rule of “doubling in ten”? No. This post shows that my investment in my IRA at the start of 1988 – 35 years ago – grew in real spending power more then 12½ times. That basically matches the exact 12X expected multiple of 3½ doublings: $1 to $2; $2 to $4; $4 to $8; and $8 halfway to $16.