Do you have a cookie-cutter retirement portfolio?
Posted on May 22, 2020

I hope you DO HAVE what would seem to others as a cookie-cutter portfolio. Patti and I have been watching more TV in the evenings and less Netflix or Prime Video. I’m seeing many more ads than usual. Almost every night I see an ad from Fisher Investments that touts, “We’re different. We tailor a portfolio to your needs. We do not recommend a cookie-cutter portfolio.” I listen and shout to myself, “YOU WANT A COOKIE-CUTTER PORTFOLIO!” You want a simple portfolio; you need only three or four basic securities. You want to pay rock-bottom fees to the financial industry. DO THAT AND YOU’LL BE IN THE TOP SIX PERCENT OF ALL INVESTORS. This post shows an example of what a tailored portfolio might look like and explains why SIMPLE is better.
== What’s a tailored portfolio? ==
My friend, Sam (not his real name), asked me to look over his portfolio. He has an investment advisor. He sent me a copy of his monthly statement. I didn’t save it, but I think it was 48 pages. Looking at it, you’d have to judge it was tailored to Steve and his wife, because it is long and complex. Something this detailed and complex must be well thought out. To my eyes, it looks like thoughtless mishmash.
I think one objective of his advisor, and perhaps the firm who trained her, is to purposely make the choice of securities seem to be a complex and sophisticated task. Sam has to look at a statement and say, “Wow. Look at all that detail! Look at all the different securities I own! I’ve never heard of most of these. It must have taken hours and hours to pick them. My advisor and firm must have the inside track with boutique fund companies and managers.”
Sam and his wife own almost 50 securities: 10 stocks and 39 mutual funds or ETFs. It took me more than an hour to lay it all out on a spreadsheet to understand. That’s the only way I could summarize all the securities they owned; get an idea of Steve’s mix of stocks vs. bonds; his weights of US vs. International; and his fund expenses. I don’t understand their advisor fees, and neither do they; fees usually are charged quarterly and this statement wasn’t at the end of a quarter. I’d need to see more statements to figure out how well he performs against two simple benchmarks for stock returns and bond returns.
The Roth accounts killed me. Sam has one and his wife has one; ~$15,000 value each and the same securities in each: 24 mutual funds in each account! Ten funds have less than $500 value; two have less than $150 value. Fund expense ratio ranges from .44% to 2.33% with a weighted average of .93%. WHAT IS THIS? How could someone actually design a $15,000 retirement account with 24 mutual funds and high expense ratio and think this was in the best interest of the client?
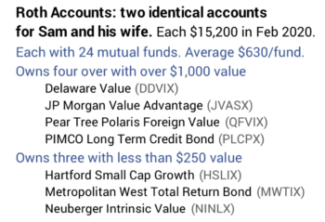
When I look at the details of each fund on the Morningstar site, I can see that some of the 24 have performed better than average; they’ve overcome their high expense ratio and beaten their peer index fund; and some performed below. Without looking at Sam’s statement over the past year or so, I can’t get the complete picture. But the chances are – with this many funds – that account will underperform a general market index fund by the difference in expense ratio: basically by .9% per year.
== It’s Worse ==
I calculate that Steve and his wife, both retired and in their 70s, have a mix of 87% stocks and 13% bonds/cash. Their statements don’t show those percentages but should have. I asked if they knew their mix of stocks vs. bonds, and they didn’t. Maybe they discussed that years ago with their advisor, but I’d bet that is not a topic that comes up in an annual review. Most retirees would shudder at that high mix of stocks.
I don’t shudder at 85% for an Investment Portfolio because I fully understand the dynamics of spending rate, mix of stocks, and investing cost. That’s what Patti and I decided on. But 85% isn’t really 85%. Our Investment Portfolio excludes five percent of our total taken – roughly one year of spending – off the top as a Reserve. (See Chapters 1 and 7, Nest Egg Care [NEC],) That means we’re really at about 80% mix of stocks on the total we have: 85% times 95% = ~80%. I’d would NOT APPROVE of Sam’s 87% on that same basis.
Patti and I have gone over this so many times that Patti can repeat the logic! We have locked-in to ZERO CHANCE of depleting our portfolio through 2034; that’s Patti’s life expectancy. We’re locked in because we know our Safe Spending Rate (SSR%) and do not exceed the Safe Spending Amount (SSA) we calculate using that. We’ve picked rock-bottom Investing Cost of less than .05%. (See Chapters 2 and 6, NEC and here). We also know a greater mix of stocks means we’ll have much more if returns don’t turn out to be MOST HORRIBLE. We see it this way: no added risk, but greater potential return from a greater mix of stocks.
== What does cookie cutter mean? ==
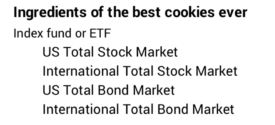
A cookie cutter portfolio to me means you hold four funds that cover the universe of traded securities as in this matrix. (See Chapter 11, NEC.) Own these and you will be in the top six percent of all investors over time. Boring, boring, boring. Easy to understand. Easy to track. And highly effective.
Conclusion: We all have an urge to have a fairly complex portfolio of stocks and bonds. Our brains think more complexity is better for something as important as our financial future. Financial firms understand this. They are going to tell you they can structure a portfolio that is tailored to your needs. They know you’ll judge that they’re doing a good job if you own many securities, securities from mutual fund companies you’ve never heard of and present them in a report that is difficult to understand. Don’t buy it. YOU WANT A COOKIE-CUTTER PORTFOLIO! You want a very simple, low-cost portfolio. You need only three or four basic index funds to win the game.