All posts by Tom Canfield

What are your mid-year To-Do’s for your Retirement Plan?

I read this article this week, “6 Portfolio To-Do’s for Retirees at Midyear”.  I don’t do ANY of the six. This post describes what I don’t do mid-year and why.


Here are the steps in the article:


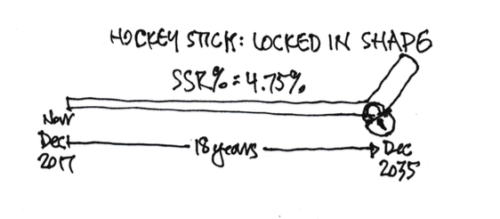
1. Check your year-to-date spending rate. I don’t need to check this. I already know where Patti and I stand, almost on a daily basis. I calculated our Safe Spending Amount (SSA) last December. Our spending rate now is 4.75% up from 4.40% at the start of our plan (January 1, 2015). Our 2018 SSA is $54,000 relative to $1 million Investment Portfolio at our start. (The terrific returns in 2017 gave most of the boost from our initial $44,000.)


Since we pay ourselves 1/12th the annual total (direct deposit from our Fidelity account into checking), all I really need to look at is our checking account: Have I had to advance a paycheck because we’ve run out of money in a month? (No.) Do I get close to zero at the end of every month? (No.) Am I building cash this time of year that tells us we  should work harder to spend to ENJOY or start thinking about gifts at the end of the year? (Yes)


The article says a retiree starting their plan should use 4% as his or her spending rate. Nest Egg Care (NEC), Chapter 2 is far more precise. The percentage changes with age: for once it’s better when you are older. That 4% rate applied to our Investment Portfolio would have been 10% too low for Patti and me at the start of our plan and would be about 20% too low now.


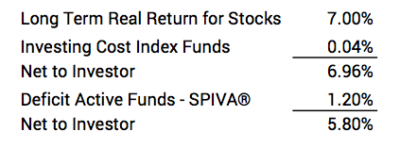
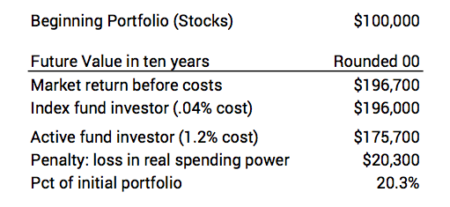
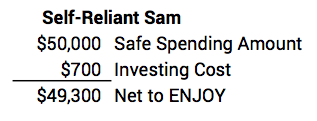
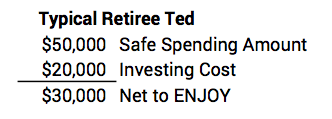
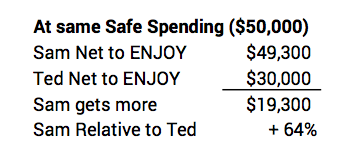
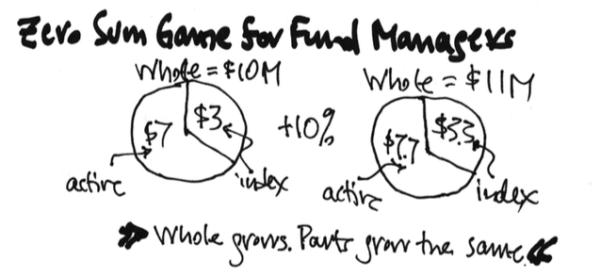
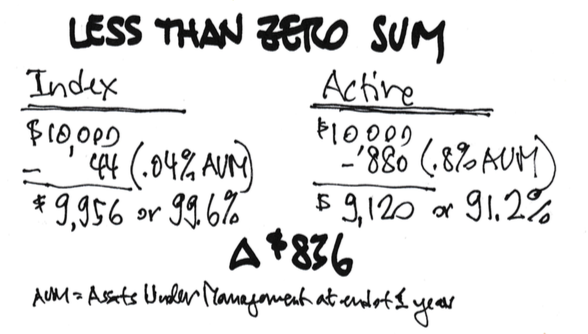
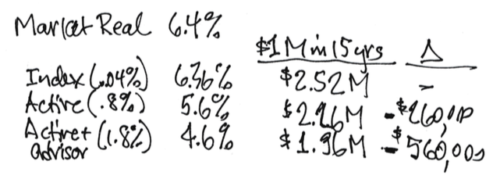
2. Check the asset allocation of your portfolio. The article says allocation of stocks and bonds is the second most important decision after spending rate. It’s really a distant third. Clearly your decision on Investing Cost is a very close second to Spending Rate to maintain long-term health of your portfolio. (I could argue that it’s the essential starting point of any retirement plan. You find out that in NEC, Part 2.) I set our stock and bond mix at the start of our plan, and that allocation does not change.


The article also says that a retiree should have two years of spending in cash. NEC recommends a 5% Reserve or basically one year of spending, but Patti and I chose two years in Reserves (Part 2), and I invest that in a Short Term Bond fund. (And I’m now including the value of 529 Plans that we “own” as part of our Reserve.)


3. Take a closer look at your cash. Again, I don’t need to do this. The only cash we have (Money Market or Checking) is the unspent balance of our 2018 SSA.


The article says one might want to increase cash because money market rates are increasing. This makes no sense to me. Rates are increasing because inflation is increasing. I’d guess the real return on Money Market is below 0%.


The article suggests “opportunistic” retirees might want to boost cash so they could bargain hunt if stocks or bonds fall. That makes no sense to me. We retirees should not be betting that we can boost returns by timing market moves. I don’t think anyone can do that successfully over what we all hope is a decades long retirement period.


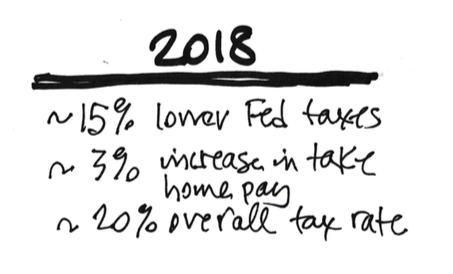
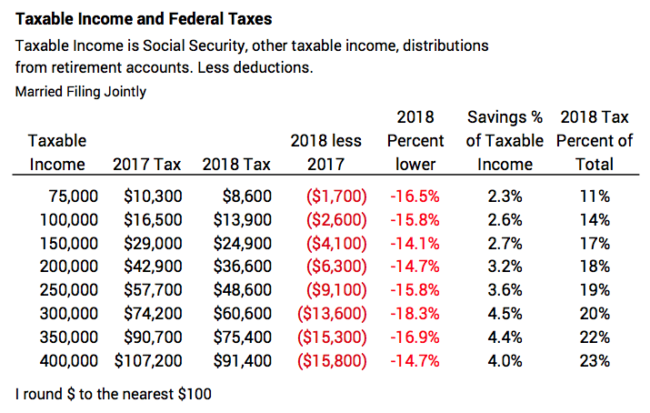
4. Take a fresh look at IRA conversions. The conversion is Traditional IRA to Roth IRA. For most all of us we’d be considering how much we might save in taxes by incurring a 22% tax rate now (Traditional) for the conversion to, maybe, avoid 24% tax rate later (Roth). The tax brackets are pretty wide. I suspect the marginal rate for most of us is 22%, starting at $77,400 for married filers; that marginal rate runs to $165,000 before the 24% rate kicks in. You’ve got to be at the edge of one bracket to even give this a thought. Predicting your future taxable income is really tough. (The change in value of your retirement accounts and Required Minimum Distribution (RMD) will be the biggest consideration.) Predicting how much of your RMD income might tip you into a higher marginal bracket is tough. The two-percentage-point difference is small. Converting would make zero sense for all but a rare few of us.


5. Develop an action plan for your RMD. I don’t need to figure that out now, since my process steps and calendar were set when Patti and I started our plan. (See Chapter 13 Nest Egg Care.) Our process is to take RMD the first week of December. We calculate our Safe Spending Amount (SSA) for the upcoming year. SSA certainly is greater than RMD, not just for Patti and me but for all retirees. So all retirees are going to take their RMD, but need to sell more securites to get to thier SSA. Largely because the lower tax bite on capital gains, most all will sell securities in their Taxable Account to get to their total SSA for the upcoming year.


The article gives some advice to those who don’t spend their RMD. Why wouldn’t you spend (or gift) all your RMD and more? Why so little? Pay yourself your full SSA!!! Spend and gift it ALL in the year.


6. Revisit your Charitable Giving Strategy. We don’t rethink our strategy. That’s set. In October we have to figure out if we will spend our full 2018 SSA by the end of the year. If not, we will gift to those we love and donate the balance to charities we really like.


We really like gifts to 529 College Savings Plans. For donations, our process is to first donate as Qualified Charitable Distributions (QCDs) from my IRA account. (I’m over 70½ and can do that; Patti hit 70½ this year.) It never hurts (and could help) by donating directly from your Retirement accounts (see Chapters 10 and 13). Our retirement accounts are at Fidelity, and it’s pretty painless to execute the QCDs.


If I donate from our taxable account, I always donate my most highly appreciated securities to our account at the Fidelity Charitable Gift Fund (FCGF) – a donor advised fund. (Others, like Vanguard or Schwab, have similar funds.) And then I ask it to make the donations to those on the list I’ve given them. This is a big time saver for me. Fidelity makes it very easy to find the securities in our taxable account with the lowest cost basis and move them over to FCGF (Donating securities with lowest cost basis give best tax advantage.)


Conclusion. If you set up your plan and process as suggested in Nest Egg Care, you really have very little to do during the year. You certainly do not have 6 Midyear To-Do’s. Your real work is concentrated over a few days after your calculation date. The work for Patti and me starts right after November 30.

Can you lose 20% of your nest egg and feel good about it?

Unfortunately, the answer is Yes. What? Lose 20% of your nest egg and feel good about it? Well, most investors effectively lose 20% of their nest egg or the biggest portion of their nest egg (stock portfolio) over time and feel good about it. This post describes why that is true and how we avoid doing that in the future. We Nest Eggers don’t want to fall into this trap.


I am on an Investment Committee for a local foundation. We hired Vanguard as Investment Advisor about five years ago. We invest in the Vanguard Funds they recommend: 97% of our total is in Index funds; about 3% is in two Actively Managed bond funds they recommend. We get an excellent comparison report, and all the funds we own perform very close to, if not identical to, their benchmark index. As information for the committee, I recently sent a short memo summarizing the recent SPIVA® report. That report compares the performance of Actively Managed funds to their benchmark index. I included these points:


Actively Managed funds in aggregate returned about 1.2 percentage point less per year than their benchmark index over the last 15 years.


The 1.2 percentage point difference would have compounded over a decade (as an example) to less for an investor – the amount less is about 20% of the initial portfolio. An investor either wins or loses the investing game relative to market returns, and in this case the investor in Actively Managed funds lost (really did not gain) 20% of his or her initial portfolio.


That second paragraph is a slightly different take on what I said here, here, and  here. How did I get that 20% loss of the initial nest egg? Why to do most all investors pay no attention to that loss?


========


How did I calculate the loss of about 20% of one’s nest egg over the last decade? I’m comparing the expected return from Actively Managed funds to the expected return from Index funds.


I start with a portfolio value of $100,000 in this example. I’m showing the effect if this was invested in US stocks only. That’s going to be the largest single holding in your portfolio. I use 7% real return. That’s the average annual real return rate for stocks since 1926. (The average real return was 9% over the last decade; that’s an amplifying effect we’ll ignore for now.)


You have two alternative investment approaches. 1) You can invest in a stock Index fund at an investment cost of .04%, meaning you net on average 6.96% per year. 2) You can invest in Actively Managed funds, and, using the SPIVA data, the expected return from these funds will be 1.2 percentage points less than market return rate or 5.8% per year. (Even the Active funds that perform at the 75th percentile underperform their benchmark index by about .5 percentage points per year.) Here are the return rate assumptions.


Now for the future value calculation. Actively Managed funds return roughly $20,000 less in real spending power – about 20% of the original nest egg. You either win or you lose relative to what you easily could have achieved, and Actively Managed funds lost $20,000. (If I used the actual returns over the decade, the loss would be 25% of the original portfolio value; that’s the amplifying effect of greater than average returns.)


========


Why don’t we grasp this? We fail to exert the slow, thinking part of our brain, the part that requires thought and calculations to understand reality.* We miss two measures of reality.


1. We only look at our absolute results and judge we did just great with Actively Managed funds (+$76,000 increase in real spending power). We never compare our results relative to what it should have been (+$96,000).


2. Inflation distorts our view. If I include 1.6% inflation per year (It averaged that over the ten year period ending December 2017.), the future value of Actively Managed funds would have been more than twice as many dollar bills  (a $100,000 dollar increase from a $100,000 start). We think we’re REALLY doing great. We lose sight of our results in terms of real spending power, and that has to be our measure of performance.


=========


My friend, Betty, told me that her (prior!) investment advisor told her, “You’ll never notice” when she asked about the high fees she was incurring with him. That’s right. Over the last decade, her portfolio would have increased nicely even with those high fund and advisor fees. But not by nearly as much as it could have. Kudos to Betty: she made the switch to be self-reliant and invest in just a few Index funds: she’ll be WAY AHEAD in the future.


Conclusion: It’s easy to delude ourselves and think we are just doing great by investing in Actively Managed funds in our attempt to outperform the market. But, based on history, the expected result from Actively Managed funds is to lose about 20% of your initial nest egg over a decade relative to what it should be. Don’t do that! Stick with Index funds.


* I liked the book, Thinking. Fast and Slow. Daniel Kahneman.

Get this 65% CASH REWARD card!

Probably all of us carry some sort of rewards credit card. We get points, miles, or cash reward on our credit card purchases. We get more to spend at what we perceive to be no cost. (Retailers are passing on their costs for our use of credit cards as higher prices.) This post describes the benefit of the primary credit card that Patti and I use, and it describes a new, SPECIAL CARD I’ve added to my wallet. Relative to most other cards, it’s 30 TIMES BETTER – a 65% cash reward card, in effect. Each of us should have this card!


========


The standard credit card I carry in my wallet earns miles (points) that we can use to purchase airline tickets. This article last Sunday was enough motivation for me to really understand what we earned with our credit card. Does our card match what’s offered today? Boy, there are sure a lot of options: see here and here.


To figure out our reward, I worked through the details of how many total miles we earned last year. For our card, that’s mostly one mile per dollar, but it’s up to 3X on certain purchases. I then figured the value of miles when applied to a ticket. I concluded we earn in dollar value about 2.5% of what we charge on our credit card. I judge that that’s pretty good. We’ll keep what we have.


========


NO CREDIT CARD HOLDS A CANDLE TO THE 65% CASH REWARD CARD THAT IS AVAILABLE TO ALL OF US REIREES. That 65% cash reward is more than 30 times better than the next best direct cash reward credit card I see – 2% on all purchases. (And no one is charging higher prices because we use cards like this one.)


Here’s the card I made, laminated, and now carry in my wallet:


And here is why it is, in effect, 65% CASH REWARD relative to other “cards”. That’s 65% ADDED CASH Patti and I get to spend or gift per year relative to many other retirees.


Here’s the logic of that. (You can read more detail in Chapter 6, Nest Egg Care.) We’ll assume two retirees of the same age in this comparison: Self-Reliant Sam and Typical Retiree Ted.


1. A Retirement Withdrawal Calculator gets us to our Safe Spending Rate (SSR%). Both Sam and Ted have to assume that they will both earn market returns in the future before any Investing Costs. There’s no other logical assumption to make. See here and here.


Sam and Ted are both 70. If you follow the detail in Nest Egg Care (Part 1 and Appendices C and D), you’ll find that 5% is the SSR% for a male, age 70. That 5% rate basically assumes No Investing Cost. We all incur some cost that’s a deduction from market returns, and our decision on that is our Investing Cost.


Let’s also assume the two have $1 million Investment Portfolio. (See Chapter 7.) They therefore each can spend $50,000 at the start of their retirement before consideration of Investing Cost. That $50,000 is their Safe Spending Amount (SSA). It’s is a constant dollar amount that adjusts with inflation each year, similar to the way Social Security payments adjust. (That real $50,000 amount could increase; see Chapter 9.)


2. Each decides how they want to spend the $50,000. First decision: how much do Sam and Ted want to spend in Investing Cost?


Self-Reliant Sam decides to spend .07% Investing Cost. That’s .07% of his Investment Portfolio; that’s easy to achieve. We can consider that as $700 per year on Investing Cost, and we could think of that as his annual card fee. Sam’s net for other spending to ENJOY is $49,300.


Typical Retiree Ted decides to spend (or fails to decide and unknowingly incurs) 2.0% Investing Cost. This is not unusual: .9% in weighted average mutual fund Expense Ratio and 1.1% in advisor fees. That’s $20,000 per year on Investing Cost. Whoosh. That’s a steep annual card fee. Ted’s net for other spending to ENJOY at the same safety mark as Sam is $30,000.


Now the comparison. On the same $50,000 that’s safe to spend, Sam gets to spend or gift $19,300 more per year than Ted. Sam gets a CASH REWARD of an added $19,300 for more spending (and/or gifts) relative to Ted. That’s about 65% boost in spending for Sam relative to Ted.


Think of what Sam could do with the added $19,300!  He and his wife could take two, two-week trips to Europe (using those other credit card rewards to help pay for the air tickets). Or, he could gift about $5,000 to 529 College Savings Plans for each of his four grandchildren. Wow!


========


I have coffee now and then with my friend John. We’re about the same age. He’s really smart and successful. But he choses to spend over 20 times what I do in Investing Cost. (He really got to 20 times by failing to explicitly decide.) Every so often, the thought runs through my head: “I’m getting 65% CASH REWARD on the coffee I just purchased. And you’re not.” Or, “We just spent the same on our coffee, but you’re spending is WAY RISKIER than mine.”


John, of course, doesn’t really see that he’s spending about $20,000 that I am not. Or, that his spending puts him at greater risk than me. That’s the beauty, if you want to call it that, of the statements he receives on his portfolio. He never gets a bill or writes a check for his Investing Costs; they’re deducted in non-obvious ways from his portfolio. In a year like 2017, he is happy as hell because his portfolio increased significantly. But the point is (averaging over time) his portfolio will increase by about $20,000 less per year than mine. Over time, that $20,000 per year compounds to a huge difference.


Conclusion. We all like loyalty credit cards that give us more money that we perceive we’re getting for free: Patti and I get miles we apply to airline tickets. The credit card in our pockets gives us an added 2% or so in value. That 2% DOES NOT COMPARE TO 65% CASH REWARD on all spending and gifts we make by being a Self-Reliant retiree. Why do we know that? We know what our Safe Spending Rate is. We know How To Invest: we incur no more than .10% Investing Cost relative to 2% that many others incur.

Now that you’re retired, how do you invest?

You make two basic decisions for your financial retirement plan: How Much to Spend and How to Invest. It’s actually three decisions:


1. How Much Should I (we) Spend (Spending Rate)?

2. How Do I Invest?

a. What Investing Cost Should I incur?

b. What’s a proper Mix of stocks and bonds?


Nest Egg Care helps you make those three decisions. Most financial advisors and most folks only focus on the latter one of the big two, How To Invest. Most TOTALLY IGNORE 2a. (Do you ever wonder why financial advisors steer clear of that one?) Those three decisions are interrelated, so it isn’t that easy to give advice on one without considering the others. But here’s my quick summary on that second basic question: How Do I (we) Invest (2a and 2b)? Do these four things and your retirement will be MUCH better.


===  KEEP (ALMOST) ALL OF WHAT THE MARKET GIVES ===


1. Only invest in Index Funds.


You want to keep as much of what the market will give to investors in the future. You have two choices. The right choice is to reliably keep (almost) all that the market will provide to all investors: invest in Index funds that mirror market returns less a very small cost. You forego the possibility of ever beating the market. You will reliably keep about 98% of what the market returns. Your total Investing Cost can be less than .07% per year. This choice will place you in the top 6% (or better) of all investors over time.


2. Do NOT bet on Actively Managed funds.


Investing in Actively Managed funds is the second option, and this is the wrong choice. Investing in Active funds is a fool’s errand. It’s mathematically impossible for Actively Managed Funds in aggregate to outperform their peer Index Funds. Actively Managed funds MUST underperform their benchmark Index Funds by the difference in their costs (Expense Ratio).


All sorts of studies tell us this is true. About 94% of Actively Managed funds underperform their benchmark index over a 10-year period. In aggregate they return about 1.2 percentage points less than their benchmark index. Active fund investors in aggregate keep just about 85% of what the market gives. That typical 1.2 percentage point deficit compounds to a huge dollar disadvantage for Active funds. You’re nuts to plan your retirement financial plan based on the ability to be able to pick the one in ~20 funds that will outperform. See Chapter 6 Nest Egg Care. 


=== KISS: KEEP ISIMPLE, STUPID ===


3. Invest in just a few Index Funds.


Patti and I only invest in four broad-based, market-capitalization-weighted mutual funds or their sister Exchange Traded Funds (ETFs). Two for stocks and two for bonds. Those four own a piece of 20,630 individual securities. That’s approaching ALL the traded stocks and bonds in the world. That’s almost the ultimate in diversification. You don’t need more funds than that, and you don’t need to own more stocks and bonds than that.


Biases in our brains work against simplicity and KISS. Our brain thinks that a portfolio with many funds or stocks gives greater diversity and therefore safety. But that’s an illusion and is not true. Owning more funds doesn’t mean you own more securities and are more diversified.


There’s no good argument to overweight your portfolio to hold more of different kinds of stocks, for example. A favorite recommendation is to own more small-cap stocks, but that tactic has made no difference over the last 30 years. If you decide to overweight one kind of stocks over others, you’re only guessing as to what will be the leader in returns.


=== STEER A STEADY COURSE ===


4. Don’t obsess, worry, and panic over Bad Variability of one-year returns. Our focus has to be on the decisions that make sure we don’t outspend and outlive our our portfolio. That (hopefully) is a distant point in the future, perhaps decades away. It’s that point far down the shaft of your hockey stick. (A plot of the year-by-year probability of depleting a portfolio looks like a hockey stick: many years of zero probability of depleting and a rising probability of depleting thereafter.)


That point down the shaft has what I call horizontal variability (the variability in the number of years of zero probability of depleting a portfolio). A Retirement Withdrawal Calculator tells us how to make the three key decisions that lock in that point, and you can decide and move that point farther away during retirement. Vertical variability (the annual ups and downs) has already been assumed and accounted for by our Retirement Withdrawal Calculator.


Patti and I know our hockey stick. It has zero probability of depleting our portfolio through 2035 – 18 years away. That’s to Patti’s age 88 and my age 91. (Unfortunately, it’s just over 8% probable that both of us would be alive then.) As a result, we pay little attention to the annual variability of returns. (But that’s been easy over the last four years since the start of our plan – only a tiny decline in one year.)


5. Don’t try to time the market.This is one of the biggest mistakes an investor can make. No one can reliably time the market. It makes NO sense to shift your mix of stocks to bonds or move to cash as a result of Bad Variability (panic in after a down year) or Too Good of Variability (guessing the stock market is overvalued). Set your mix of stocks and bonds and forget it. (You’ll Rebalance to your choice annually, though).


=== MIX: NOT SO TOUGH A DECISION

IF YOU THINK IT THROUGH ===


6. Your decision on the mix of stocks and bonds requires some hard thinking and understanding of the tradeoffs among your choice of spending rate, investing cost, and mix of stocks and bonds. Saying that differently: your choice of Spending Rate and Investing Cost makes the decision on Mix a pretty easy one. But the emotional part of your brain will tell you to hold more bonds that the thinking part of your brain will tell you.


I cover this decision in Chapter 8 in Nest Egg Care. For this post, I’ll give a few quick views.


a. Think of Bonds as insurance. Many think they should hold bonds to smooth annual variability of returns, and that’s not the right way to think about them. You own bonds to extend and protect that distant inflection point on the shaft of your hockey stick. You have bonds so you don’t have to sell stocks (or as much stocks) in a year when they’ve cratered. (Historically they crater one in ten years.) When you sell a disproportionate amount of bonds, you’re cashing in on your insurance in that year.


b. You actually don’t want too much insurance (bonds). The average annual, real return for stocks (above the rate of inflation) is about 6.5% to 7%. Bonds 2.6%. When we experience normal sequences of market returns – and that’s most likely – holding bonds grows to be very expensive. Those return difference compound to huge dollar differences: stocks typically will double in purchasing power about every decade; it will take bonds more than 25 years to double.


Conclusion: Now that you are retired or nearly so, the rules or rationale of How to Invest  are not very complicated. You really get to understand and believe the rules when you put a Retirement Withdrawal Calculator through its paces to decide your 1) spending rate, 2) investing cost, and 3) mix of stocks and bonds. (That’s what Nest Egg Care does!)


How well do Active funds perform (Version 2)?

I read this article last week, Charts change hearts and minds better than words do. People understand better (and might think differently than they have in the past) by looking at graphs rather than by reading text and numbers in a table.


So, this post is a simple restatement of the major conclusions of last week’s post, but I experiment and use graphs to convey the same key information. Refer to that post for the actual data I used for the graphs.


======


The SPIVA® Report Year-end 2017 compares the performance of Active funds (Actively Managed funds) to the SP Index or benchmark return for the fund’s style or cell in the style box. You can think of the benchmark returns – basically – as the returns investors would receive from Index funds (You can find an Index fund for each style.), because the Expense Ratio of Index funds is so low.


1. Over the most recent three-year period, 85% of Active funds failed to outperform their benchmark index, and over 94% failed over the most recent ten-year period. The other way to say this: over the last three-year period,  just 15% of Active funds beat their benchmark index; just 6% beat their benchmark over the last 10-year period. (Excuse my wobbly drawing of the curve.)


2. Actively Managed funds in aggregate, returned about 1.2 percentage points less per year than their benchmark index.


3. The penalty from the deficit grows to a very signifant amount over the years. I use the average  return for the recent past 15 years. Assume the initial investment is $100,000. The dollar deficiency or penalty from -1.2 percentage points per year looks small in the beginning. But then it continues, and all the prior-year deficiencies compound. Soon the cumulative dollar deficiency is REAL MONEY!  The investor suffers a penalty of about $30,000 over ten years; $80,000 over 15 years; and $150,000 over 19 years.


You can also see that the line on the graph bends south more steeply over time. That means the annual penalty grows at a faster clip year after year. The annual penalty started at about $1,200 the first year (not too bad, eh), but grew to $10,000 per year after 13 years and grew at $15,000 per year after 16 years (OMG).


4. What holds true for US Stocks also holds true for International stocks and for US and International Bonds. About 80% fail to outperform their benchmark index.  (I display representative components.)


5. Hold Index funds, and you will be in the top 6% of all investors. This is point #1 restated. (You’ll actually be better than this, since the typical investor in Actively funds holds more than one. The more he or she owns, the overall return will gravitate to the 1.2 percentage point deficit.


Conclusions.


1. You can describe results with words. You can show the data in Tables. You can show data in Graphs. I would agree that our brains grasp what the data tells us more quickly from a graph. Lesson for Tom: use more graphs in my blog posts!


2. You’re retired. Don’t spend money to try to beat the market. That’s a fool’s errand. Everything tells us retirees to invest only in Index funds.

What’s does the latest SPIVA® report on Actively Managed funds tell us?

You’re retired. You can’t waste money. You want to keep the most you can from future market returns. You can pay more (greater Investing Cost) to try beat the market. Or, you can reliably keep almost all of what the market gives – but with no prospect of ever beating it – by investing in low cost Index funds. A decision to spend more in an attempt to beat the market is a very bad (perhaps dumb) choice. Only invest in Index Funds: reliably keep just a shade less than overall market returns.


This post summarizes a recent SPIVA® Scorecard. (You can see and download the report here.) The report shows that over the long haul, about 94% of Actively Managed funds fail to beat their benchmark index. Only a fool would build a retirement plan betting on the ability to pick the 1 in 20 that manage to beat an Index Fund. (As background, this post explains why, in aggregate, Actively Managed funds MUST underperform Index funds.)


What’s an Actively Managed fund? An Actively Managed fund employs a fund manager (company) that actively buys and sells securities to pick winners and avoid losers in an attempt to outperform. These funds have relatively high Expense Ratio, largely due to pay to their highly compensated investment managers and, perhaps, commissions they pay to those who hawk the funds to investors.


What’s an Index fund? An Index fund simply works to mirror or match the aggregate change in total value of the set of stocks or bonds contained in an index. The typical index (and therefore Index fund) holds an amount of each security in proportion to its market capitalization value relative to the total for all the securities in the index. (Market capitalization value is share price times number of shares.) Index funds don’t try to beat the market, don’t trade securities, and have very low Expense Ratio – typically about 1/20th that of an Actively Managed fund. Because of the low Expense Ratio (My Expense Ratio for my largest holding – a US Total Stock Market fund – is less than .04%.), an investor keeps about 98% of what the market gives all investors before costs.


A number of companies use stock performance data to build indices that they sell to mutual fund companies and other investors to use as benchmarks of performance. The granddaddy of these market capitalization indices is the SP 500® Index. It contains 500 largest companies that total about 80% of the total market value of all 3,500 US stocks. S&P Dow Jones Indices, LLC provides that index and many more. (CRSP is  an example of another provider of indices; Vanguard uses CRSP indices as benchmarks for many of its funds. See the wiki entry here.)


The indices for the US that are most helpful benchmarks fall into the style box below. Other services analyze the holdings of an Actively Managed  fund and characterize its category or cell in the style box (The detail in the SPIVA report describes how this is done.)


========


Here are my takeaways from the 33-page SPIVA report. It compares the performance of just Actively Managed funds relative to their benchmark index; the report does not include Index funds. (A previous post described the report for the period ending June 30, 2017.)


1. Over a 15-year period, about 94% of all Actively Managed funds failed to outperform their benchmark index. You can see below the percent that failed to outperform their benchmark index for different periods. I’m amazed at the high percentage – roughly 85% – that fail to outperform in just three years.


2. Actively Managed funds return perhaps 1.2 percentage points less per year than their peer benchmark index. (This 1.2 percentage points has to be very close to the aggregate annual Expense Ratio for Actively Managed funds over this time period.)


A deficit of 1.2 percentage points per year over the last 15 years compounds to roughly 15% fewer dollars for all those who invested in Actively Managed funds. Wow! (You’d have less if you also pay  advisor fees.)


3. Even if you were able to pick the Actively Managed fund that performed at the 75th percentile of all Actively Managed funds (performance that is better than 75% of all Actively Managed funds), you’d be well below the benchmark index.


4. Hold Index funds, and you will be in the top 6% of all investors.* That’s all we have to do. We can’t truly own the Index used in these comparisons, but our Expense Ratio is so small (less than .04% in some cases), that we essentially are receiving the index return.


You can see how hard it is to pick a winning Actively Managed fund that consistently remains in the top quartile of funds over time. I construct this table from data you’d see at the SPIVA web site.


5. What holds true for US stocks (and that will be your largest holding) also applies to International stocks and US and International bonds. Here is a snapshot.


Conclusion: You’re retired. Don’t waste money. Paying high Investing Costs for Actively Managed funds means (with very high probability) that you’ll keep significantly less of what the market will give. You are simply throwing money away. Don’t try to beat the market. Invest solely in Index Funds. You will keep about 98% of what the market will give investors, and you will be in the top 6% of all investors over time.*


* You’d actually be better than this. An Active investor owns more than one fund. The more he/she owns, the overall return will gravitate to the average 1.2 percentage point deficit per year. It’s a remote statistical probability that an investor with as few as four Actively Managed funds can have an overall result that outperforms an Index fund investor.


Two really good $100 purchases on our vacation in England

A few years ago, I found I was very grumpy and sometimes a bit frustrated with spending money that we just did not NEED to spend. I’m much less concerned – actually totally unconcerned about $100 expenditures – now that I understand our annual Safe Spending Amount and pay it out monthly. The point of this post: you can Enjoy from spending a relatively small amount of money, especially if you look at what the incremental spending buys.


Patti and I try to spend two weeks in England every year. Patti marshalls the frequent flyer miles, and in some years we’ve flown at $0 for the airline tickets. So it’s affordable travel for us. We’ve missed a few years, but not that many recently. We just got back from the Lake District, our fourth visit in five years. It’s just terrific. Every year we meet someone from England who volunteers, “This is the best part of England.” Our entertainment and almost daily activity is walking or hiking. The bus and cab transport in England is very good, and we have not rented a car for many years.


The really good $100 Expenditure #1. (Actually less than $100.) Our target was to get to Philadelphia for a 9 PM flight that would arrive in Manchester at 9 AM the next morning. Our Pittsburgh to Philadelphia flight was first delayed because of bad weather in Philly. Then when that cleared, a storm hit us as we sat on the runway waiting to take off. We landed just a few minutes before 9 PM and missed our scheduled flight. We had to fly to Dublin and then wait to catch an afternoon flight that arrived in Manchester at 3:30 PM.


I had purchased an Advanced fare rail ticket that would leave the Manchester airport at 10 AM and arrive at 1:30 PM at Maryport, a short cab ride from our first stay, Cockermouth. The Advanced fare was $105 for the two of us (£78). Less than half price. The rub is to get that fare you must make that 10 AM departure (with a little leeway for delayed arrivals to Manchester; the leeway does not extend to five or six hours, though). So, that $105 was gone.


Option 1. Sitting in the Dublin airport, I first looked at the National Rail App on my phone for trains leaving near 4:30 PM. There was one, but Advanced fare did not apply. The same-day fare for the two of us was $215 (£162). We’d get to Maryport at 7:45 PM.


Option 2. Patti looked at the cost of a one-day car rental on her rental car apps. We’d pick up the car near the Manchester airport (That’s not nearly as simple of a process as in the US.) and drop it off the next morning close to Cockermouth (30 minutes away; bus ride back). Cost would be $217 all in. (Collision coverage is outta sight; roughly $70 for the one way drop off fee.) And the thought of driving as tired as we were was definitely unappealing. The process of turning it in the next day would also be a hassle.


Option 3. I thought: would our reliable taxi in Cockermouth be willing to drive to Manchester, meet us at the departure exit, and drive us to Cockermouth? This is about the last option I would have normally considered: a 142-mile cab fare! I texted, and the answer was “Yes” for a cost of $266 (£200). Fantastic. I said, “Great,” and we were on. Tracy met us at the departure exit, and she got us to Cockermouth at 6:30 PM. We had a terrific dinner at a great vegetarian restaurant at 7:30, strolled back along the river’s edge, slept like logs, and were off on our first hike the next morning.


Some thoughts ran through my mind in the Dublin airport. I could have thought of all this as a $371 problem (the $105 that was burned plus the extra $266). But I viewed it differently. The $105 I had already spent on Advanced fare was a sunk cost, and I’d saved far more than that in all the past years. Forget it.


I was going to at least have to spend $215 to get to where we wanted at to. The incremental cost for the 142-mile cab ride was just $50. That was $50 to have someone meet us at the departure exit, figure out all the driving and traffic, and drive us 142 miles away (and Patti was able to nap).


I also knew two paychecks were hitting our checking account: my Social Security paycheck arrived that day, and our bigger paycheck – the monthly portion of our Safe Spending Amount – would arrive in two days. I also knew that we spend almost $1,000 per month LESS on Investing Cost relative to others I know. (And, in my view, they get no value for this.) This $50 was absolutely an ENJOY NOW bargain.


The Really Good $100 Expenditure #2. Several years ago Patti went into the National Trust shop in Grasmere, a fun village to walk around. One of our loop hikes started there. Patti wanted to buy a throw – a cover we’d use if we took a nap on the couch. It was probably $75. But we already had one or two. I sneered, “We don’t need another throw. The one we have is just fine.” She didn’t buy it. I thought about that after I had figured our Safe Spending Amount, and realized that I was denying her a little ENJOY MORE, NOW over a $75 purchase. Not a good move.


Sure enough, this time she went in the shop, looked at the throws, and picked out one that she liked. This time I said, “That looks great. Do you like it?” “Yes. And I like supporting the National Trust.” “Then get it, and I think I have room to carry it back for you.” A smile and a little enjoyment for Patti for $100. Priceless.


Conclusion: You can find Enjoyment from small expenditures. It helps me to think of the added benefit from the incremental amount that I am spending, not the total. It also helps to have a dollar amount that you do not worry about spending if it gives you or your spouse/partner a little joy.

What’s the one-page Take Away from Nest Egg Care?

We have to start with the right questions. I think these two are the right distillation for us retirees.


I wrote Nest Egg Care to answer those two. Those five pictures above are the one page Take Away.


1. You should view your financial retirement in terms of a) a hockey stick and b) a pile of money,.


a. The plot of the year-by-year probability of depleting your portfolio looks like a hockey stick: many years of zero probability of depleting (the shaft length) and a rising probability thereafter (the blade angle). You determine the stick shape (and the size of the pile)  by three key decisions, below. The most important variable that you want to control is the length of the shaft. We use a Retirement Withdrawal Calculator to give us the year-by-year probabilities.  We always use the most horrible sequence of returns ever to determine shaft length for a set of decisions (see below).


You decide the number of years you want for ZERO worry. Using our life expectancies as a guide (Patti 70 and Tom 73), Patti and I chose an 18-year shaft length. We have no risk for 18 years and some risk thereafter. But 18 years is beyond each of our life expectancies; it’s just 8% probable that both of us are alive then; and we have many years to adjust if the returns we face are dismal. I discuss why 18 years makes perfect sense to us in Chaper 3, Nest Egg Care.


b. The expected future spending power of your nest egg is more than you have now. That’s the pile of money at the end of your stick. It’s the pile that would be there if returns are normal (not crazy abnomally bad) and you stick with your initial spending amount, just adjusting for inflation each year. For Patti and me, the expected pile in 18 years is 45% MORE than we have now.


2. Three decisions lock in shaft length and the size of your pile of money.


• Spending rate. This is the biggest control knob that sets the shaft length of your stick. Lower spending is a longer shaft (and bigger pile of money). Greater spending is a shorter shaft (and smaller pile of money). The two decisions below have an effect on the Safe Spending Rate (SSR%). The SSR% is 4.75% for Patti and me: that’s solid for 18-year shaft length and 45% bigger pile of money.


Investing cost. I could argue this is more important than Spending Rate since low cost is so critical in ensuring that the rate is indeed safe. It’s a decision you must make, and most folks don’t even consider it as part of their financial retirement plan. Big mistake.


Investing cost is the deduction from aggregate market returns. We all incur some costs, but many retirees think they can overcome inherent costs and beat the market. They’re shooting themselves in the foot. Many incur two percentage points of investing cost and that equates to perhaps a 35% reduction from market returns. Patti and I decided on .10 per percentage point cost – 1/20th that of many others. We have about a 2% reduction from market returns. Our cost is easily achievable with index funds.


Our low investing cost also translates to a bigger potential pile of money. Ours is about two-thirds more – over $500,000 more – in purchasing power relative to an initial $1 million – than someone who incurs a two percentage point cost at our spending rate and stock-bond mix.


Mix of Stocks and Bonds. This third decision is much less important than the first two, although many obsess over this one. A mix of more bonds has a surprisingly small positive effect on shaft length, but it has an outsized negative effect on the pile of money. I discuss the tradeoffs between spending rate and mix in Chapter 8, Nest Egg Care. Patti and I are perfectly comfortable with 85% stocks and 15% bonds: that’s rock solid for our 18-year shaft length at our low investing cost and 4.75% spending rate.


3. You must Recalculate often. The return pattern that we will experience almost certainly will be better than the one assumed that drives the initial (or current) Safe Spending Rate to a low level. Also, when you are older (let’s think 85), you don’t need to plan to have your money last as many years as when you were younger (let”s think 70).


Patti and I recalculate annually. Our Safe Spending Amount for 2018 is now 20% more than that for our 2015 spending. See here and here.


4. Pay yourself your annual Safe Spending Amount (SSA). (See Chapter 5, Nest Egg Care for details on the calculation.) You want to pay yourself so you can clearly see that you don’t overspend. But most folks, in my view, UNDERSPEND and UNDERGIFT while they are alive. Paying yourself has a big psychological benefit that lets you focus on point #5.


5. Enjoy More. Now. The sands of time are running. Statistically, you have less time left than you would like. Make the most of it. I have in my head that we’re given about 1,000 months; I’ve run through 875; 125 left. That’s maybe just 12 more summers with Patti. We have to focus on “What’s the next fun thing to do?”


And in a typical year – when we haven’t spent all that we’ve paid ourselves – we are able to ask, “Who should benefit from our increased giving ths year? And how much?”


This one thing is certain: you’ll enjoy your retirement more when you give to your loved ones and//or fund your favorite causes while you’re still around to appreciate the positive impact you’ve made.


Conclusion: You can view your financial retirement plan as a hockey stick and a pile of money. Your stick is the plot of the probability of depleting your portfolio for a given set of decisions on spending rate, investing cost, and mix of stocks and bonds. Your decisons on those three lock in the number of years of zero probability of depleting, and they lock in the expected future value of your nest egg at the end of the stick if returns are normal.


You must Recalculate often during retirement, since it’s almost certan that your annual Safe Spending Amount (SSA) can increase.


Pay yourself your annual SSA. Paying yourself has a powerful, positive psychological effect: you’ll focus on how to spend to Enjoy More, and you’ll know you can Give More while you are alive.

Why MUST Actively Managed funds in aggregate underperform Index funds?

Two weeks ago my blog post discussed the performance of a set of Actively Managed US Stock funds as compared to their peer index funds. I cited this study in another post. I discussed this with an investment pro who DID NOT GET the fact that IN AGGREGATE actively managed funds MUST underperform the Index fund by the difference in their costs (primarily Expense Ratio). Try as I might, he did not understand. Maybe he didn’t want to understand, since his business is based on selling his ability to pick Actively Managed funds for his clients. Maybe I was not clear enough.


The post provides a painfully more detailed story of why the statement is true. You can also see and print the story in one picture. This is a BIG DEAL – perhaps worth $250,000 for you – as you will see. (Also see Chapter 6, Nest Egg Care.)


The Set Up. This is obviously a simplified structure of investors and stocks. It’s a valid picture. This story lasts one year. We have 100 investors: 30 invest in one Index fund (does not trade stocks that are part of its portfolio) and 70 invest in 70 different Actively Managed Funds (those that trade stocks often to pick winners and rid their portfolio of losers).


The total stock market consists of 500 companies. Each company has 1,000 shares of stock. That’s 500,000 shares in total. The number of shares for each company (and the total) does not change. Stock price can change and therefore the Market Capitalization Value (MCV) can change for each company and in total. MCV = total shares * price/share.


At the start of the year, the average price of all shares is $20/share. That makes the total MCV of all shares $10 million (500,000 shares * $20/share).


The range of price of shares and therefore the MCV of individual companies is quite wide. Higher priced shares (companies with greater MCV) account for a much greater percentage of the $10 million of total MCV than others. Here are the top three companies and the bottom three out of the 500.


During our year the price of each stock changes. On average, prices increase 10% to an average of $22/share. Some increase by more than 10%; some increase by less; some decline. The MCVs of most all the companies change. The ranking of individual companies from greatest MCV to least changes. But in aggregate the total MCV of all the companies increases by 10% to $11 million (500,000 shares * $22/share.)


What do investors hold at the start of the year?


• The big Index fund holds 30% of the shares of each stock; 300 shares of each company. That’s a total of 150,000 shares and total market value of $3 million. Each of the 30 investors owns an equal amount of the fund. In effect, each owns 10 shares or 1% of each company and 1% of the total MCV of all. That’s a market value of $100,000.


• The other 70 investors each own one Actively Managed fund, and each fund starts out identically to each of the shareholders of the big Index fund. Each fund owns 10 shares or 1% of each company; that’s also a market value of $100,000. All the funds together own 700 shares of each stock; 350,000 shares in total with a total MCV of $7 million.


What do managers of these funds do during the year?


The manager of the Index fund does very little. He’s performing the administrative task of maintaining the ownership records of the 30 investors. He does not buy or sell any shares during the year. At the end of the year, the Index fund still holds the same 300 shares of each stock – the same 150,000 shares in aggregate.


The value of stocks increased by 10% on average in the year. While some went up and some went down, the Index fund still holds 30% of each. Value increased by 10% or by $300,000. Ending value was $3.3 million.


The active fund managers freely trade shares among themselves. Managers knock themselves out in the effort to buy more of what each thinks will be winners and unload those each thinks will be losers. The Index fund manager doesn’t buy or sell a single share, so the Index fund  isn’t part of this game. An active fund manager can only buy from another active fund manager who sells.


The value of stocks increased by 10% on average in the year. All the funds in aggregate still hold 70% of each and 350,000 shares. Value increased by $700,000. Ending value was $7.7 million.


This is the ZERO SUM GAME: both index fund and active fund managers increased in aggregate by the same percentage during the year before costs they incur. There’s a whole and two parts. The percentage of the parts does not change. The whole grew by 10%. Each part grew by 10%.


====


But the number and nature of shares of each Active fund changed. During the year, for example, some fund managers sold a few of the really high priced shares priced shares to buy lots of lower priced shares in an effort to overweight their holding with smaller company stocks. Some sold lots of shares of smaller company stocks to buy more of larger company stocks. Some sold to be able buy more technology shares. Some sold to buy more stocks that pay a high dividend. And so on. But every time someone bought, someone had to sell and vice versa.


The result is varied portfolios for each fund. But in aggregate all funds still own 700 shares of each company and 350,000 shares in total. They all stated out with the same $100,000 value and the average value at the end of the year for all the funds is $110,000, but individual funds will have more or less than this value. Some managers made the right decisions or bets and held more of shares of stocks that increased by more than 10%. Those who made the wrong bets did worse. Those who increased in value by more than 10% did so at the expense of those who did worse. The only source for outperformance is from the underperformance of other actively managed funds.


====


Investors are dealt a LESS THAN ZERO SUM GAME: the return to investors, in aggregate, is less from Actively Managed funds exactly by the amount of their increased costs.


• The Index fund charges its investors .04% of the assets under management. At the end of the year, its total fees – a deduction from total value of the fund – are $13,200 (.04% X $3.3 million). That works our to $44 per shareholder in the Index Fund.


The increase in value of the Index Funds before the deduction of costs was $10,000 for each owner of the fund. After the deduction of the $440 fee, each investor received $9,956. That’s 99.6% of what the market gave before costs.


 Active fund managers charge (on average) 0.8% of assets under management. That’s 20 times that of the Index fund. At the end of the year, their total fees in aggregate are $61,600 (0.8% X $7.7 million). That works out to $880 per investor.


The increase in value for all the funds in aggregate before the deduction was $700,000 or $10,000 per investors on average. After costs they received $9,120. They received 91.2% of what the market gave before costs. They received $836 less on average than each Index fund shareholder.


(Some of the investors in these funds hired other advisors to help them pick the Actively Managed fund to invest in. If this was an added fee of one percentage point, those folks received 80% of what the market gave to all investors before costs.)


====


It’s very tough for an individual Actively Managed fund to overcome its higher cost and outperform an Index fund. It can only do this if other Actively Managed funds do very poorly, and they all are trying to outperform. Over 15 years about 19 in 20 US stock funds cumulatively underperform their benchmark index fund.


If you go Active, just to breakeven relative to your friend who’s a shareholder of the Index fund, your pick has to be no worse than the of the top 5% to 7% of the bunch. If your pick of an Actively Managed fund is average in the pack, you keep about .8 percentage point less per year than your friend. Over a retirement horizon of, say, 15 years and average returns, that is more than $250,000 LESS FOR YOU (stated in constant purchasing power) per starting $1,000,000 invested. This is a BIG DEAL!


Conclusion. The math of all this is pretty darn simple. Index funds and Actively Managed funds own part of the the total market. Both parts rise and fall by the same percentage in aggregate. Index funds return to investors a very high percentage of what the market gives all investors before costs: their costs are as low as .04%. Actively Managed funds return less; the amount they return less is the difference in their costs (.8% vs .04%). At expected real return rates, that difference compounds in 15 years to perhaps $250,000 relative to a $1 million starting investment; that $250,000 is stated in constant purchasing power.

How much lower will your taxes be in 2018?

I visited my accountant, Bob, this week to finalize my 2017 taxes. Yep, I was little late completing them, but he finalized the returns and filed them this week. When we sat down, he gave me some information for my tax planning for 2018. I’m clearly not a tax expert, and you should rely on your pro. But I’m passing on what I learned in this post.


I conclude we can expect roughly 15% lower Federal taxes in 2018 for the same Taxable Income as 2017. Taxable income is basically line 43 of your 1040. That’s your Adjusted Gross Income (line 38) less Itemized Deductions (line 40).


[Note: Your Taxable Income may not be calculated the exact same way in 2018 as in 2017. The change I’ve heard about most is the limit on Itemized Deductions.


Deductions for state and local income and property taxes are limited in 2018 to a total of $10,000. That has little effect on Patti and me, since state (PA) and local (Pittsburgh) taxes on retirees are low. Neither tax Social Security or retirement income: they taxed it when we earned it; they gave us no deduction for contributing to our retirement accounts. Also, we can avoid Pennsylvania taxes on any other income if we choose to. Therefore, our calculation of taxable income in 2018 will be very similar to the way we calculated it in 2017.]


I show the detail of the tax bracket changes here. I summarize the effect on Taxable Income in the table below. You can see that this works out to be about a 15% or more cut in Federal taxes for a wide range of incomes. That translates to 3% or so increase of Taxable Income that’s in our pockets – more fun money for us.


I display incomes up to perhaps ridiculously high amounts, partly to see how the percentage tax reduction affects higher incomes. [But older retirees could have high incomes, because their calculation of their Safe Spending Amount will be much higher: their Safe Spending Rate (SSR%) is much greater, and with recent market returns, all of us have a bigger investment portfolio – even after high withdrawals for spending.]


I’m also clearer on the total percentage tax I will pay. I used too low of withholding rate in 2017 for our estimated quarterly payments and for withholding when I took my withdrawal from my retirement accounts. I’ll adjust to 20% to make sure I’m covered.


Conclusions. My rough picture of the impact of new tax rates means we’ll all see about 15% or so lower Federal taxes. The increase in our take home pay is a meaningful amount. We can all have more fun. Or give more to those we care about.


We all should use 20% (or close to 20%) for quarterly estimated taxes on Social Security and other income and withholding on withdrawals from our retirement accounts.