How well do Active funds perform (Version 2)?
Posted on June 22, 2018

I read this article last week, Charts change hearts and minds better than words do. People understand better (and might think differently than they have in the past) by looking at graphs rather than by reading text and numbers in a table.
So, this post is a simple restatement of the major conclusions of last week’s post, but I experiment and use graphs to convey the same key information. Refer to that post for the actual data I used for the graphs.
======
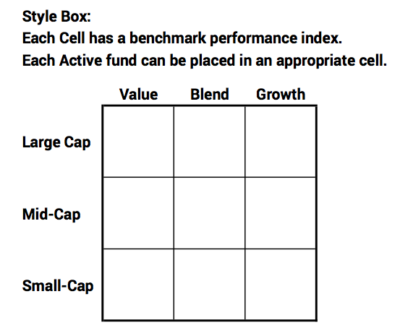
The SPIVA® Report Year-end 2017 compares the performance of Active funds (Actively Managed funds) to the SP Index or benchmark return for the fund’s style or cell in the style box. You can think of the benchmark returns – basically – as the returns investors would receive from Index funds (You can find an Index fund for each style.), because the Expense Ratio of Index funds is so low.
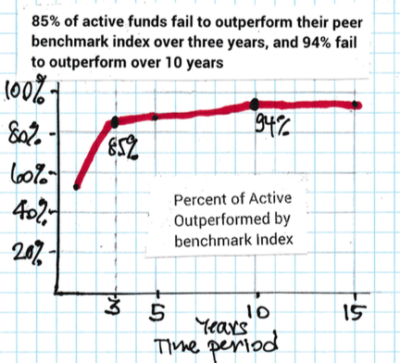
1. Over the most recent three-year period, 85% of Active funds failed to outperform their benchmark index, and over 94% failed over the most recent ten-year period. The other way to say this: over the last three-year period, just 15% of Active funds beat their benchmark index; just 6% beat their benchmark over the last 10-year period. (Excuse my wobbly drawing of the curve.)
2. Actively Managed funds in aggregate, returned about 1.2 percentage points less per year than their benchmark index.

3. The penalty from the deficit grows to a very signifant amount over the years. I use the average return for the recent past 15 years. Assume the initial investment is $100,000. The dollar deficiency or penalty from -1.2 percentage points per year looks small in the beginning. But then it continues, and all the prior-year deficiencies compound. Soon the cumulative dollar deficiency is REAL MONEY! The investor suffers a penalty of about $30,000 over ten years; $80,000 over 15 years; and $150,000 over 19 years.
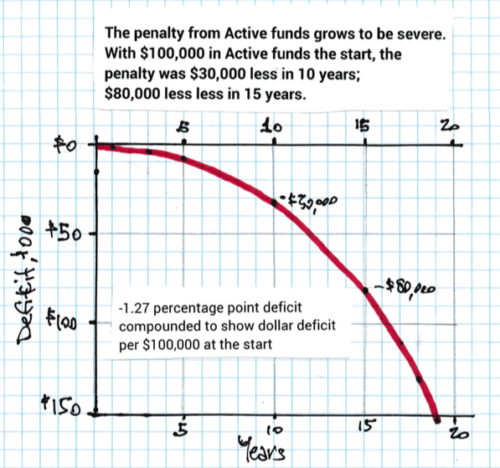
You can also see that the line on the graph bends south more steeply over time. That means the annual penalty grows at a faster clip year after year. The annual penalty started at about $1,200 the first year (not too bad, eh), but grew to $10,000 per year after 13 years and grew at $15,000 per year after 16 years (OMG).
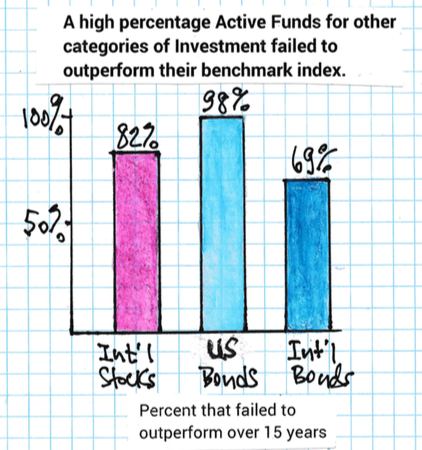
4. What holds true for US Stocks also holds true for International stocks and for US and International Bonds. About 80% fail to outperform their benchmark index. (I display representative components.)
5. Hold Index funds, and you will be in the top 6% of all investors. This is point #1 restated. (You’ll actually be better than this, since the typical investor in Actively funds holds more than one. The more he or she owns, the overall return will gravitate to the 1.2 percentage point deficit.
Conclusions.
1. You can describe results with words. You can show the data in Tables. You can show data in Graphs. I would agree that our brains grasp what the data tells us more quickly from a graph. Lesson for Tom: use more graphs in my blog posts!
2. You’re retired. Don’t spend money to try to beat the market. That’s a fool’s errand. Everything tells us retirees to invest only in Index funds.