
Continue reading Where do I get annual returns for my calculation of our Safe Spending Amount?
All posts by Tom Canfield

What are Time-Weighted Returns and Money-Weighted Returns?
Patti and I follow the CORE in Nest Egg Care (NEC). We Recalculate annually to see if our Safe Spending Amount (SSA) can increase by more than inflation. (I recommend you Recalculate at least every three years; see Part 3, NEC.) Patti and I use November 30 for your 12-month return rates for our calculation. As reference, here is our calculation sheet from last year; read more here.
Our Investment Portfolio is at Fidelity®. Fidelity posts return rates for each account a few days after the end of each month. The summary page shows two different definitions of return rates for an account: the 12-month rate for an account is a money-weighted return. The summary also shows the rate for the S&P 500® Index as a point of comparison, which they state is a time-weighted return. And Retirement Withdrawal Calculators use time-weighted market returns for their construction of sequences of future returns we may face.
Uh-oh. Now my brain is muddled. What’s the difference in the two? It’s much simpler for me to track changes in our portfolio by using published time-weighted returns for each of our holdings. If I do that will I be accurate in my calculations over time? The purpose of this post is to answer those questions.
My summary: Time-weighted and money-weighted returns are essentially identical for nest eggers who put their SSA into cash soon after their Recalculation date. It’s faster and easier to simply look up the returns for each of the four securities we own and multiply by our design percentages for each that we had at the start of the year. That means on December 1, I’ll look up the time-weighted 12-month returns for each holding in our portfolio as of November 30. Within two business days I’ll complete my transactions to get to our SSA into cash for the upcoming year and will also be in perfect balance for the next 12-month period.
What are Time-Weighted Returns? A time-weighted return is the rate an investment changes in a year assuming an amount was invested for the complete year. This calculation includes the effect of dividends reinvested but ignores the effect of investment inflows or outflows. You can think of it as the daily return rates compounded for the year.
When you look up the returns for mutual fund or ETF at Morningstar or other site, you are looking at time-weighted returns calculated in the same way (i.e., dividends reinvested). When you compare a fund’s returns to an index – the S&P 500® index is an example – you are getting an apples-to-apples comparison of performance.
What are Money-Weighted Returns? (These are sometimes called Dollar-Weighted Returns.) A money-weighted return includes the effect of the timing of investment inflows and outflows during a year. The calculated return rate for an account recognizes that the amount you invested changed during the year and that each new increment of investment changed at a different rate and different length of time than for the whole year. It’s your personal return rate – combining those changes – that you experienced. This return will generally will differ from the time-weighted return.
Here’s an example: in our example year, the time-weighted annual return is 0%. You start with $1,000 and with no additions or withdrawals you wind up with $1,000. Daily returns compounded to +10% return for the first six months; returns compounded to -11.1% for the last six months. The total of the compounded daily returns for the year was 0%: (1 + 10%) * (1 – 11.1%) -1.
Let’s assume you added $200 at the six-month mark. For the first six months, your $1,000 investment grew by 10% to $1,100. You added $200 for a total of $1,300 for the start of the next six months, and then this total declined by -11.1% or by -$144.30. You wound up the year with $1,155.70. Relative to the $1,200 total you invested throughout the year, you experienced a decline of $144.30. Just dividing the two ($144.30/$1200) would tell us that we experienced about a -3.5% decline.
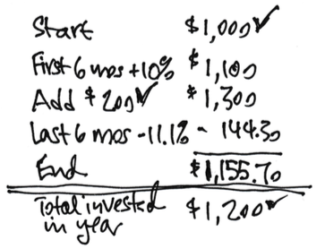
I won’t go into the math of how to calculate the annual money-weighted return rate for this example, but the detailed calculation of money-weighted return works out to a -4.0% decline. That’s your personal return rate for the year.
We nest eggers don’t have to be concerned about the difference in the two: use time-weighted returns; they’re quicker and easier to find. We don’t need to be concerned about differences in the two for three reasons. The first reason is that we are only a few days off in the timing of our withdrawal for our SSA for the upcoming year. Return rates aren’t going to depart by much. I will have the 12-month returns ending November 30 on the morning of December 1. Within the next two business days I’ve sold securities to get our SSA into cash for the upcoming year – Rebalancing as I sell. I’m in perfect balance for the start of the new 12-month year at the end of those two business days. (See spreadsheet under Resources above that helps with Rebalancing.)
The second reason is that we are withdrawing a small percentage of the total. The smaller the percentage we withdraw (or add) during the year, the smaller the difference between the two returns.
The third reason: over time tiny distortions in a year are going to average out to be almost no distortion over, say, five or ten years.
Conclusion: I saw that several returns displayed on my portfolio page at Fidelity used different kinds of returns: money-weighted returns and time-weighted returns. Those terms muddled my brain. It’s easier to me to look up published time-weighted returns for my holdings to find the total return for our portfolio. I conclude it’s just fine to use those return rates in my annual calculation of our upcoming Safe Spending Amount (SSA).

What do I do to minimize taxes and keep more for us?
Our Safe Spending Amount (SSA) is the pretax amount we can withdraw and spend from our nest egg that ensures we have zero probability of depleting our portfolio for the number of years we have selected. Nest Eggers always take their full SSA. Patti and I both now must take RMD, but we still we have to find other sources to get to our total SSA. This post describes the steps I take to spend less in taxes so that we keep more to enjoy. I’m basing our actions on the current structure of federal income tax rates; I’m not going to guess if, when, or how they might change in the future.
Here’s my summary: I always take one simple step that will always lower taxes we pay: donate using QCD. I’ll spend more effort to “manage our taxable income” if I think I can avoid passing a trip point that cuts the net we get to keep beyond that point: there’s a big one at high taxable income and a lot of smaller trip points along the way. Personally, I’m not going to sweat those smaller trip points unless I get far more energetic about the task of controlling taxable income.
==== Too many trip points ====
This table below (more detail here) shows quite a few trip points that lower the amount we get to keep as our taxable income increases. I count nine trip points between $77,400 to $400,000 of taxable income for Patti and me (filing joint, married).
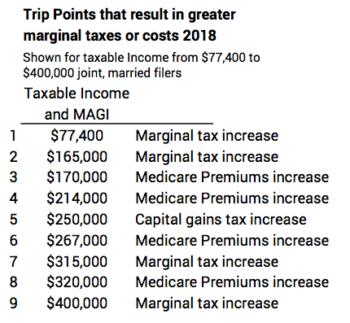
That’s too many trip points for me to track and worry about: most of them have relatively small effect on the amount we get to keep. I’m going to focus on the big changes that can come from increases in tax from marginal rate increases in Federal income tax. I am not going to work very hard to avoid the trip points on Medicare premiums or capital gains taxes. The exception might be the two trip points close to each other at about the $250,000 mark. Of course, if I know I’ll be well below that $250,000, for example, I don’t have much of a task to try to manage our taxable income.
==== Try not to fall off a ledge ====
I like to display the current income tax table in terms of how much we keep at different levels of taxable income rather than the marginal tax rates we pay. In the graph you see two ledges where we keep much less of the marginal income that goes past a ledge. In between the two ledges we see a long run of income with a small step down in the percentage of income that we get to keep.
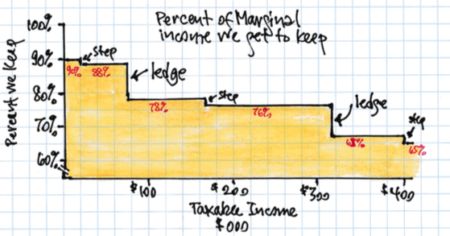
The first big ledge is at $77,400 (joint married; $38,700 for single filers). That’s an immediate ten-percentage point reduction in the amount we keep of income after that ledge. For discussions here, I’m assuming we all are beyond that ledge.
Then we have a long run from $77,400 to $315,000 ($38,700 to $157,000 for single filers) – over $235,000 of taxable income – with just a small step down at about 35% along the way. Patti and I get to keep 78% before that step or 76% after. The difference is 2.6% less that we keep. I’m not going to obsess over the 2.6%. Or, really those other trip points along that run. I’ll let the chips fall where they may unless I get really energic and precise in controlling taxable income. .
The second big ledge is far out there at $315,000 ($157,500 for single filers); Patti and I get to keep 8 percentage points less of the income that goes over that ledge. That’s so far out that most all of us won’t ever cross it. We don’t have to do anything special to avoid it. But if I ever thought I’d get close to that ledge – and perhaps other trip points – I would want to “manage our taxable income” to avoid crossing that ledge. How might I do that?
==== Act to lower taxes you pay ====
We all can act to avoid or lessen taxes and the chances that we’ll ever have income that falls over that big ledge at $315,000 or other trip points you might select.
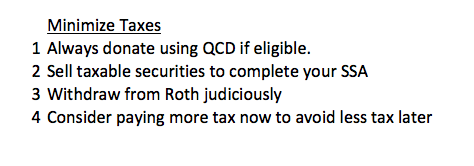
1. Always use QCD for donations if you are eligible – over 70½. I explain the benefits here. You always get a full deduction from income and therefore full benefit of lower taxes with donations from QCD. That almost certainly is not the case now if we stick with the option we’ve used for donations used for years: submitting them as part of itemized deductions: stanadard deduction before you get the benefit of itemized deductions is much higher now.
You have an added potential benefit when you use QCD. QCD is not included in Adjusted Gross Income (AGI) or Modified Adjusted Gross Income (MAGI).* You may avoid crossing a trip point that is calculated on the basis of MAGI: added payments for Medicare premiums or for higher capital gains taxes. The mechanics to donate using QCD are not simple for me, but in our case we’re lowering our income taxes by a couple of $1,000 by using QCD. It’s worth the extra effort.
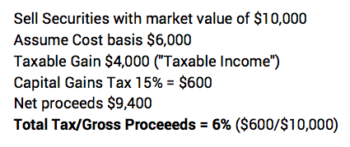
2. Net the most from sales of securities from your Taxable account by selling your highest cost shares first. Selling securities from your taxable account will always net more than the alternative of withdrawing more from your Traditional IRA retirement accounts and record far less taxable income. (See below). You can even do better. Choose to sell specific, higher cost shares, and this results in lower taxable income and lower capital gains taxes now. (You’re actually deferring to a larger tax bite later when you must sell the lower cost shares.)
3. Judiciously withdraw from your Roth account for your spending. (Note: at this point Patti and I do not have Roth retirement accounts.) In my opinion, you want to use your withdrawals from any Roth funds you have to avoid a higher marginal tax bracket or perhaps other trip point you can avoid. I think many folks don’t think this one through correctly. I explain the differences in the benefits of Roth vs. Traditional IRAs here.
It’s appealing to think that you should use Roth first – and not sell taxable securities for your spending – since it’s a “tax free” distribution or withdrawal. It’s tax free now because you previously paid tax at a marginal rate to get the money to put in a Roth account. Roth benefits you, relative to your Traditional IRA, if you withdraw to avoid paying a greater marginal tax than you originally paid.
Here’s the error that some fail to avoid. Let’s assume you paid a 25% marginal tax to get the money you put into a Roth. You now don’t want to withdraw funds from your Roth account to avoid, for example, paying taxes on withdrawals from your Traditional IRA in the 12% marginal tax bracket (for a portion of your first $77,400 of taxable income). If you do this, you have immediately “lost” 13% of the amount of Roth you withdraw relative to using money from your Traditional IRA.
Again, if you paid 25% marginal tax to get the money to put into your Roth, you don’t want to use Roth to avoid paying 22% or 24% marginal tax. Again, you’re really losing money on the Roth relative to using the money in your Traditional IRA.
4. Consider paying more in tax now to avoid a greater marginal tax bracket later. I discussed this in the same post as above. In my view this would be an obvious consideration for someone who thinks they may at some point cross that $315,000 line but is in a relatively low marginal tax bracket now.
A good example is my friend, Jay. He’s 66. He may retire soon. His earned income will fall dramatically. He has a very significant retirement account. He foresees that he could cross that $315,000 ledge in the future. He has the potential to withdraw the same amont for spending over time but spend less total tax. His strategy would be to convert a portion of his current IRA to a Roth account. He’d incur (we’ll assume) a 22% tax now. He’ll withdraw from his Roth later to avoid recording income that would result in crossing the $315,000 line. He would immediately “make” about 14% on the amount he converts.
Conclusion: Act to lower your taxes. You have one simple task that almost certainly lowers your tax bill: use QCD for donations if you are eligible.
Selling securities from our taxable account is a low cost way to get cash for your Safe Spending Amount (SSA) – or to get to the balance you need if you have to take RMD. You can do better if you sell specific, higher cost shares.
I would use money you have in Roth accounts judiciously to tactically avoid hitting trip points triggered by increased taxable income.
It takes more work to control your taxable income to avoid sharp increases in marginal income tax or other trip points. I would work hard on this task if I ever thought Patti and I would record taxable income more than $315,000 ($157,000 for single filers). I might get more energic on two trip points near $250,000 of income: I’d sweat the details of paying more tax now to avoid a greater marginal tax later. I’d convert Traditional to Roth.
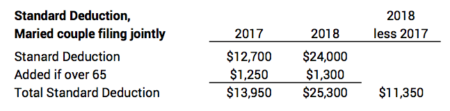
* AGI is the income calculated at the bottom of page 1 of your 1040 return. MAGI adds back some deductions that were used to calculate AGI. For most all retirees AGI = MAGI. Taxable Income is AGI less deductions, such as the standard deduction of $26,600 for joint filers, married and both over age 65 in 2018.
I helped Alice with her year-end tasks this week
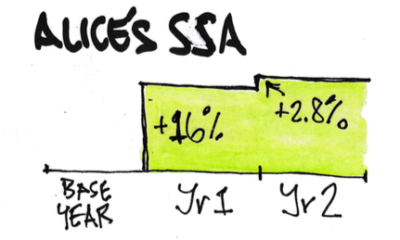
Alice’s Recalculation date is October 31 (see Nest Egg Care, Part 3). She follows the CORE and recalculates each year. Returns in 2017 were terrific, and Alice’s Safe Spending Amount (SSA) calculated as +16% last year – well above the 2% inflation rate. Returns this year won’t justify a real increase. Alice will pay herself the same amount she did last year adjusted for 2.8% inflation. The purpose of this post is to describe the year-end tasks. (Also see Nest Egg Care, Chapter 13.) We had two tasks: decide next year’s SSA and decide how to get it into cash.
==== Decide SSA for 2019 spending ====
1. I entered three pieces of information on Alice’s spreadsheet that looks similar to ours: inflation for the year (2.8%); the 12-month return for her stocks (2.5%); and the return for her bonds (-1.9%). (You have template of a spreadsheet for your SSA calculation in the Resources section on www.nesteggcare.com.)
2. The spreadsheet calculates the rest. It first calculates her Safe Spending Amount (SSA) for 2019 if it increased by the 2.8% inflation adjustment. It then calculates the alternative: the spreadsheet uses her current portfolio value and calculates the SSA that it could support. If her portfolio value increased enough, that value will be greater than the inflation-adjusted value. She uses the greater of the two.
The spreadsheet says she has to use her current SSA adjusted for inflation. Alice’s Safe Spending Rate (SSR%) last year was 5.3%. That’s what she withdrew from her Investment Portfolio last year. To justify an increase in her SSA, she’d need to basically replace that withdrawal – have a real (inflation adjusted) portfolio return close to that 5.3%; thats about 7.7% with the 2.8% inflation this year. But her portfolio return for this year was 1.4% – her combination of the 2.5% for stocks and the -1.9% for bonds. (Our SSR% increases as we age – we aren’t worring about as many target years of zero probability for depleting that we did when we were younger – and this means we don’t quite have to earn back what we withdraw to justify a real increase in SSA.)
========
I look at real return rates to understand what’s happened. The real return for Alice was -1.4% for the year. That was her combination of real return of -0.3% for stocks and -4.6% for bonds.
I focus on stock returns: they’re great on average but not good at all at times. I view bonds simply as insurance. I’m less concerned about them. Bonds aren’t going to sink our ship, but stocks can because they can bunch up a few years of really horrible returns.
None of us like to see any decrease for stocks, but returns below 0% are not unusual. Statistically, the -0.3% return is about a one in three-year event: that’s saying that we could expect to see stock returns below zero in one in every three years.
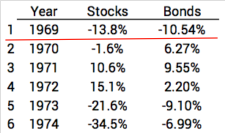
And the slightly negative return for Alice is nowhere close to the first year of the most horrible sequence of returns I find in the past. That’s the one we always assume for our planning. It’s the one that the drives our SSR% and therefore our SSA to a really low level. You can see the snapshot of that return sequence below and read here. The first year of that sequence started with real stock returns of -14%. The -0.3% looks darn good compared to that. (You can also see the back to back HORRIBLE real stock and bond returns of 1973 and 1974 .)
==== Decide what to sell ====
The remaining maintenance tasks were straightforward. Her SSA is the total value or pre-tax proceeds of securities she needs to sell. She needs to know how much stocks and how much bonds to sell. I used the spreadsheet shown under Resources on the home page at www.nesteggcare.com. That made short order of the task. After the sales, Alice winds up with her portfolio in perfect balance (e.g., mix of stocks and bonds).
The spreadsheet mentions that it can be a bit tricky to figure out what specifically to sell (Taxable or Tax Deferred) for lowest tax cost and therefore highest net cash for spending. Alice’s RMD is well below her SSA, but deciding what else to sell was not complex in her case. Once we had the net cash (after withholding for taxes) from her gross SSA for 2019, we adjusted the monthly payments from Alice’s Fidelity account to her checking account: 2.8% more than last year.
Conclusion: To find your Safe Spending Amount (SSA) for the upcoming year, you enter three numbers on a spreadsheet and it calculates the rest. Alice found – as I think all of us will find this year – that returns on her portfolio did not support an increase beyond the normal increase for inflation. Once you know your total SSA for the upcoming year, you sell securities to get SSA into cash; you use a second spreadsheet to make sure you sell correctly: you end with your portfolio in perfect balance. The tasks are not difficult. They just take some time. It’s less and less each year as you get comfortable with the routine.
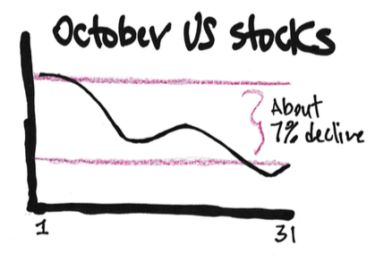
Were you bothered by the market decline in October?
I was not. The nominal decline in my portfolio was about 5.7% in the month. Your return would have differed if your portfolio weights (US vs. International) and mix (stocks vs. bonds) differ from mine. That decline was painful to see on the display of the total value of our portfolio. That was a pretty steady decline of a lot of dollars per day and week. Why didn’t this bother me?

It didn’t bother me and should not have bothered you, because we nest eggers have a much longer view of what’s important. I keep reminding myself that daily, weekly, and monthly ups and downs are basically meaningless. Those ups and downs aren’t the correct measure of risk for us. The risk point or variability that we’re worried about is the inflection point of the hockey stick of our financial retirement plan: the number of years you picked for zero percent probability of depleting your portfolio. That was 18 years for Patti and me at the start of 2018. We know we made the correct decisions to basically lock in those 18 years. Our real risk at the point is almost non-existent: we’ve locked in those 18 years. (And we’ve basically locked in the pile of money we’ll have in the future when the sequence of return isn’t worst case.)

That inflection point (where the blade angle starts) is determined by the most horrible sequence of returns in history. Our results will always be better if we don’t ride one of those most horrible sequences – shaft length will be longer and that pile of money will be bigger. And horrible sequences were presaged or predicted by very unfavorable economic conditions that led to a very long bear market. Here are conditions that DON’T look unfavorable now.
1. Problematic inflation. It’s higher than last year, but clearly not a problem. It’s basically at its very long run average rate.
2. Tight money policy. Fed rates are higher but are not higher in attempt to squelch inflation. Real rates are about 0%.
3. Recession threat. GDP growth remains strong; the risk of near-term recession is low.
4. Investor exuberance. Indicators of bullish expectations of investors are below average.
5. High valuations. The trailing P/E of the S&P 500 was 18.1 at the end of October relative to 19.2 over the past 25 years.
We feel better when we take a longer look. Returns over the past three to five years (even ten) look more average. For reference the average real annual return for stocks is 7.1% and for bonds it’s 2.3%. (I did not inflation adjust the nominal returns shown here.)

The shortest return period I want to be concerned about is one year. I focus on the 12-month return ending November 30. That’s the portfolio return rate I use when I Recalculate to find our Safe Spending Amount for the upcoming year. (See Nest Egg Care, Part 3.) It obviously still looks likes none of us will Recalculate to an increase more than for inflation for next year.
Conclusion: Stock returns in October were about -7%. Bond returns were about -.5%. So what? We nest eggers can’t get upset or excited about one-month returns. Or three-month returns or even one-year returns. Our focus is on the risk point that is much farther out on the shaft of our hockey stick – perhaps decades away. The shaft length is the number of years you picked for zero probability of depleting your portfolio, and with the right decisions (spending rate, investing cost, mix of stocks vs. bonds) you’ve eliminated the variability or risk in the number of years to that point.

Should I convert some of my Traditional IRA to Roth?
This post discusses the basics of Roth and Traditional IRA or similar retirement plans and how we should think about them when we’re near retirement or retired. The big issue for me: should I convert some of our Traditional IRA to Roth? The answer is that I should have paid more attention to this in the past, but I really must pay attention now. You should, too.
========
When you save and invest in a retirement plan, you pay tax once, either before you contribute to the plan (Roth IRA) or when you withdraw money for your spending (Traditional IRA and others). Roth and Traditional give you the same financial result if your marginal tax rate later, when you withdraw your money from your IRA, matches your current marginal rate. Both give you the exact same after-tax amount of money to spend.
Here’s an example. Bob Roth and Suzie Traditional will have the same 22% marginal rate then as now. Bob and Suzie both start with $5,000. Bob pays his marginal 22% tax now (Roth) and Suzie pays her marginal 22% tax later (Traditional). They both invest now what they can in stocks and wait 30 years. They earn the historical, average real return rate for stocks – 7.1% per year. That translates to doubling of spending power (constant dollar value of their investment) every decade. 30 years is three doublings, and their investment increases by a factor of eight: 1 to 2; 2 to 4; 4 to 8. They both net the same $31,200 when they withdraw the money for their spending.
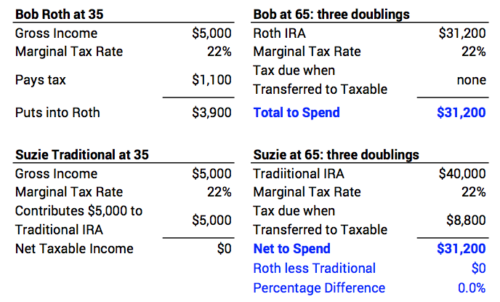
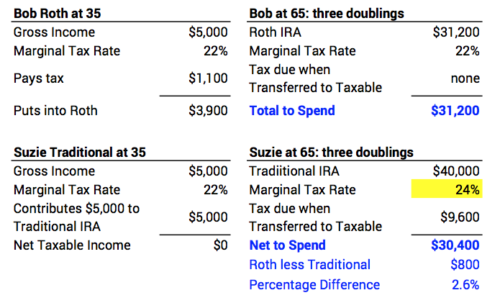
Roth and Traditional are not equivalent when the marginal tax rate now differs from the one later. It turned out Suzie had greater income later and crossed into the 24% tax bracket. She paid two more percentage points in tax on this increment for her spending than Bob did. Roth wins out and provides 2.6% more than Traditional.
The bottom line: You’re going to have to pay tax one time on the money you put in and then take out of your retirement account: now or then. You try to figure out the lowest marginal tax rate now or then. Do you assume that you’ll be in a higher tax rate in the future? If so, favor Roth and pay the lower tax rate now. And the opposite is true: if you assume you’ll be in a lower tax rate in the future, favor Traditional and pay the lower tax rate then.
========
I got serious about Saving and Investing for retirement in the late 1970s and early 1980s. Marginal tax rates were much higher than now. Avoiding current tax (the deductibility of my contribition to my retirement plan) was a powerful motivator. When I started it was obvious that the first money I put into a retirement plan would come out at a lower tax rate. All my contributions were in my Traditional IRA (or similar that gave me a current tax deduction). Roth was not a consideration then. It started in 1997.
My retirement accounts are much greater than I would have imagined, and they most probably will grow even though I take out at least my RMD each year. I can run FIRECalc and see that I can expect to have 40% more portfolio value in the future after safe withdrawals for spending. (See Nest Egg Care (NEC), Chapter 2.) My RMD percentage will be 6.5% in a decade and the rate I likely would use for the Safe Spending Amount for Patti and me will be more than that (NEC, Appendix G). I’m pretty sure I’ll we withdrawing more from our retirement accounts in the future and will have more taxable income. Should I convert some of my current Traditional to Roth?
I need to figure out how much better off I might be from converting. I’d decide a gross amount to convert; I’d sell securities to provide the cash for tax to be withheld; I’d then transfer the net securities to a new Roth account. My brokerage house (Fidelity in our case) calculates the value of the total converted to report as taxable income.) The benefit is that I avoid a greater marginal tax in the future, and – an added benefit – I lower the amount I’m forced to withdraw in a year (RMD) since my Traditional will be lower; that gives means I can fulfill our requirement for our Safe Spending Amount by selling more from our taxable account at much lower capital gains taxes.
The table below shows when it’s most important to consider converting. (Print here.) The column on the right shows the percentage more you get to keep if you keep taxable income out of the next higher tax bracket. Two breakpoints stand out. I display the table for Married filing jointly; both Billy and Jay in the examples use this table.)
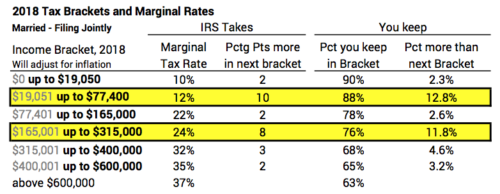
Breakpoint 1: You want to avoid crossing $77,400 in Taxable income. That’s the 2018 amount; this number will adjust for inflation each year. The amount of income that crosses that line will cost you ten percentage points in greater tax.
Billy is 58. He estimates his taxable income this year at $50,000. He has a nice nest egg in his retirement account. He thinks through the potential that it will more than double by age 70 and is convinced that at some point in the future he will cross that $77,400 line with his Social Security and just his RMD withdrawals from his IRA. What should Billy do?
Billy: convert gross amount of $27,400 of your Traditional to Roth. Sell enough for the 12% tax you want withheld. Transfer the net $24,110 securities to your new Roth account. You just avoided ten percentage points in tax. You could view it as immediately making $2,740: 10 percentage points * $27,400 in less taxes. You’ll have at least that much more to spend in the future (assuming positive real returns in the future). If you wait a decade before you withdraw your Roth that could be $5,480 in today’s spending power.
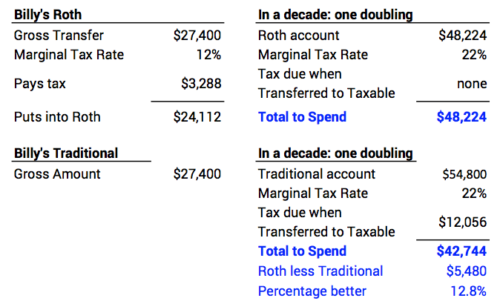
Billy, it’s never a mistake to convert. If you never reach that 22% bracket, you haven’t lost a dime. You’re no worse off. Remember Bob and Suzie.
Breakpoint 2: You want to avoid crossing $315,000 in Taxable income. The amount of income that crosses that line means eight more percentage points in tax.
Jay is 64 and he estimates his taxable income for 2018 will be $170,000. Jay hit it big on some investments in his IRA and has $5 million, all Traditional. He thinks through what his portfolio might look like at age 70½ and beyond and is convinced he’ll have income of more than $315,000 in today’s dollars in the future. What should Jay do?
Jay: convert $145,000 of your Traditional IRA to Roth. Follow the same steps as Billy. After your withholding for taxes, you’ll have securities worth $110,200 in your Roth. You just avoided eight percentage points of tax. Just like Billy, you could think of it as immediately making $11,600: 8 percentage points * $145,000. In a decade, that could be $23,200 more for you in today’s spending power. Not bad at all for perhaps an hour of work for planning and implementation. Go for it, Jay.
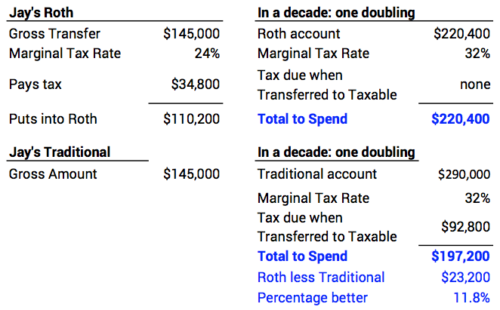
And you haven’t lost a dime if you never get to that 32% bracket.
========
You can do this same analysis for other brackets. You always save when you can avoid taxable income in a bracket with higher marginal tax rate. For brackets other than these two, it’s either two or three percentage more in future taxes.
Conclusion: Converting some of your Traditional IRA to Roth always saves if you can avoid paying a higher marginal tax rate in the future. There’s no downside to converting Traditional to Roth. (That assumes you aren’t going to drop down in marginal tax rate.) Some folks could avoid as much as ten percentage points in tax on the amount converted; they would net as much as 13% more than they would otherwise have.
Our Safe Spending Amount will increase by 2.8% for 2019
Social Security always adjusts the amount of dollars it pays us so we closely maintain the same spending power over time. It announced last week that it will pay us retired folks 2.8% more dollars in 2019. And we Nest Eggers will also pay ourselves 2.8% more green pieces of paper in 2019: it looks like none of us will Recalculate this year and find we can take a greater than inflationary increase, unlike the result for all of us last year.
For Patti and me, that means our 2018 SSA of $54,000 – relative to an initial $1 million Investment Portfolio at the end of 2014 – will adjust to $55,500. We’ll use the same multiplier as in the past to get to our total SSA for 2019.
Let’s think Real for a minute or two:
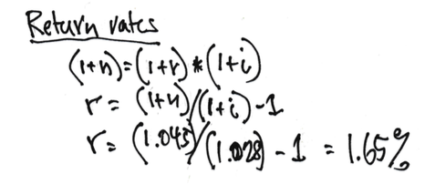
The 2.8% increase in inflation also means the real returns for stocks and bonds will be lower than the stated nominal returns that we all follow. For example, if the nominal returns for stocks wind up at 4.5% for a 12-month period (Right now it’s looking to be less than this.), the real return would be about 1.65%.
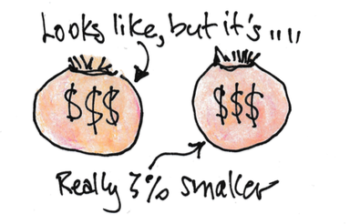
The 2.8% increase in inflation also means that the real spending power of our portfolio is about 3% less than the count of dollars we look at now.
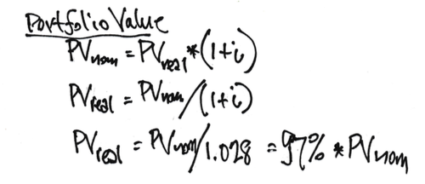
When we all Recalculate (Patti and I recalculate just after November 30.), we’ll have a more accurate picture of returns and the real 12-month change in our portfolio value.
Conclusion: We’ll all have 2.8% more pieces of green paper with dollar signs on them to spend in 2019. Unfortunately, the spending power of our portfolio has shrunk by about 3% from inflation.

Don’t throw money away! Use QCD for donations if you are eligible.
I worked through my October tasks for our retirement plan last week. That included a rough picture of what my 2018 tax return might look like. This sunk in: I MUST use Qualified Charitable Distributions (QCD) from our retirement accounts for our donations. I preserve the tax benefit (deductibility from income) if I use QCD. If I don’t, I lose: I’ll pay too much tax; I’m throwing money away. The purpose of this post is to explain why Patti and I must use QCD for donations and why that likely is true for you, too.
Here’s the summary: If you are at least 70½ years old in 2018, you are eligible to use Qualified Charitable Distributions (QCD) for donations from your retirement accounts. Always donate as QCD. The key is that QCD is excluded from the calculation of your Adjusted Gross Income (AGI) that shows on the bottom of the first page of your Form 1040 tax return. Use QCD to lower your AGI on page 1. That means your donations are fully deductible from your income. That’s not always true if you itemize deductions on page 2 on your tax return. Don’t donate from your checkbook assuming you’ll be able to deduct your donations as part of itemized expenses that you’d subtract on page 2 of your tax return.
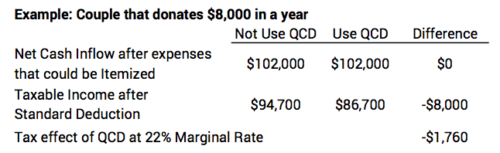
I needed to review the basics and march through an example to fully understand. When we’re finished with the example below, you’ll see that using QCD lowers taxable income by $8,000 (the assumed donations) and results in $1,760 less tax.
========
The basics: the new tax law increases the standard deduction to $25,300 for a married couple filing jointly. That’s about $11,400 more than in 2017. If you have less than $25,300 in itemized deductions for 2018, you’re going to take the standard deduction of $25,300. You’re not going to itemize deductions.
We all have three major kinds of expenses that could be deducted from Adjusted Gross Income to get to our Taxable Income. (Tax is calculated on Taxable Income.)
1. Local and State Income and Property Taxes (limited to a maximum itemized expense in 2018 of $10,000)
2. Mortgage Interest (also some new limits that are beyond most all of us)
3. Gifts to Charity – Donations (also a limitation that is beyond most all of us)
For most all of us retirees, those first two definitely will not exceed $25,300, and also for most of us the sum of the three won’t exceed $25,300. We’d take the Standard Deduction. That would mean that none of those three have a beneficial tax effect. Spending is on an after-tax basis.
========
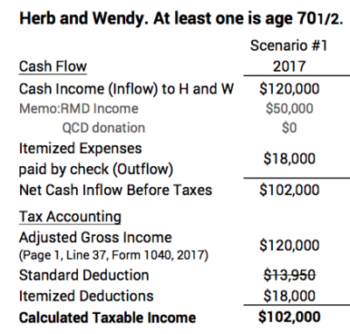
Here’s an example to show the benefit of using QCD. Herb and Wendy are both over 70½ in 2018; they weren’t aware of QCD in 2017. In 2017 they had $120,000 in Adjusted Gross Income. Of this amount, their RMD was $50,000. They had state and local income and property taxes of $6,000; mortgage interest of $4,000; and charitable donations of $8,000 that they wrote out of their checkbook: total of $18,000.
Scenario #1: calculation of 2017 Taxable Income: The amount of money in their pocket after those three expenses but before any taxes was $102,000 ($120,000 in less $18,000 out). In 2017, they would have itemized deductions, because their $18,000 of itemized expenses was in excess of their ~$14,000 standard deduction. Therefore their Taxable Income for 2017 was $102,000 ($120,000 Adjusted Gross Income less the Itemized Deductions of $18,000). Relative to the standard deduction, they received ~$4,000 of added deductions. They could view that a portion of their donations to charities lowered their taxable income and total taxes.
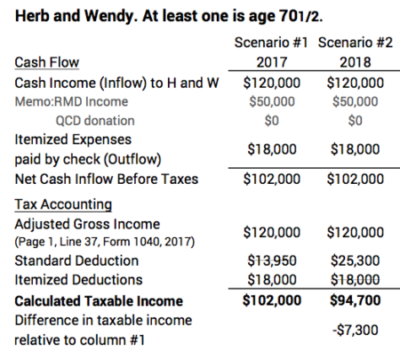
Scenario #2: calculation of 2018 Taxable Income: Let’s just repeat that exact same income and spending scenario for 2018. They have the same $102,000 cash in and cash out before paying taxes. The standard deduction now is $25,300. That’s greater than the $18,000 of expenses they could itemize. Herb and Wendy would take the standard deduction. Taxable income for 2018 is now $94,700 ($120,000 less $25,300). Herb and Wendy have lower taxable income and therefore lower total taxes. They keep more of that $102,000 for themselves. They are correct in viewing that none of their charitable donations had an effect on further lowering their taxes. In essence, all their donations are after-tax gifts.
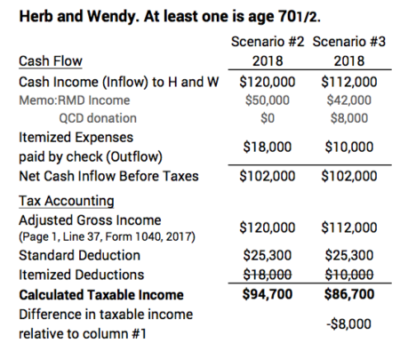
Scenario #3: repeat 2018 but use QCD. Herb and Wendy use QCD rather than writing the $8,000 from their checkbook. They still have the $102,000 net of cash in and cash out before taxes. The accounting difference is that the QCD is not included in the calculation of Adjusted Gross Income: AGI is now $112,000 ($120,000 less the $8,000 QCD). They still take the $25,300 standard deduction. Taxable Income for 2018 is now $86,700.
Herb and Wendy received the $25,300 Standard Deduction and $8,000 QCD that also lowered Adjusted Gross Income: a total of $33,300 to get to the lower Taxable Income. Relative to Scenario #2, they have $8,000 lower Taxable Income than they otherwise would have for 2018. At a 22% marginal tax rate, this is $1,760 less tax paid.
I lay out the three scenarios side by side here.
========
An added benefit of using QCD is that the calculation of Modified Adjusted Gross Income (MAGI) will be lower. Herb and Wendy could pay greater Medicare premiums if their MAGI exceeds certain income thresholds. The first level of increase in Medicare premiums occurs at $170,000 MAGI for married couples.
========
I’ve found the mechanics to implement QCD are not as simple as writing a check. I have to print a form, fill it out designting charities and amounts, get a Medallion Signature Guarantee (which I’ve not found to be a straightforward task), and get the form to Fidelity. But it is sure worth the effort now.
I like doing this planning at this time of the year in advance of my recalculation date of November 30 and all the tasks that follow in early December. I can plan donations and QCD. Some folks I know use a December 31 calculation date and take their Required Minimum Distribution at the start of the year; I think I’d find that difficult for planning and implementing QCD.
Conclusion: We retirees who are at least 70½ must make our donations directly from our retirement accounts (QCD). Most of us will find that we will take the greater Standard Deduction in 2018 and also receive the full tax benefit (lower tax) from our charitable donations.
What are my early October tasks for my retirement plan?
I work on my financial retirement plan two times in the year: early October and early December. I spend time in early October to get a good picture of the tasks for December. That’s my month of heavy lifting. The purpose of this post is to list what I do in early October every year.
I probably spent a total of four to six hours on the tasks. The most time consuming tasks were to think through our actions for gifts and donations and to estimate the appropriate tax withholding percentage on our distributions from our retirement accounts. I did a lousy job estimating my total tax bill last year.
Here is what I do:
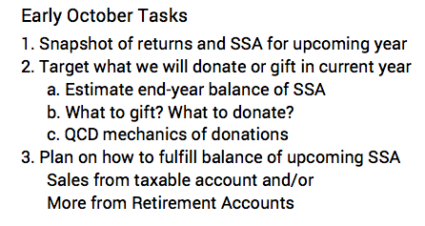
1. Get a sense of our Safe Spending Amount (SSA) for 2019. I did this last week. Our SSA for 2019 clearly looks to be the same as for 2018. I’ll only adjust the dollars we pay ourselves for inflation.
2. Decide the amounts we might want to gift or donate to charities before the end of the year and decide how we’re going to do that.
a. Estimate the amount we’ll have left over from our 2018 Safe Spending Amount. Patti and I paid ourselves about 15% more SSA in 2018 than we did in 2017. We did not hold back on travel this year – clearly our greatest discretionary expense – and we have a healthy balance in our checkbook now. More than last year at this time. We have two more monthly payments, and we don’t have any unusual upcoming bills or purchases. I therefore have a good idea of the amount we will have left for gifts + donations.
b. Decide on what to gift and what to donate. Patti and I first decided on gifts. We like gifts to family and heirs as contributions to their retirement accounts and to 529 plans – gifts they’re not likely to spend now and that will almost certainly compound to much more in the future. Our total gifts this year will be similar to last year’s. That means we can plan to donate more to charities we really like (See several we like in Chapter 10, Nest Egg Care.) We like that we’re able to do more of this.
c. Decide on the mechanics of the donations. I’m older than 70½ and Patti turned 70½ in 2018. We must always donate first using Qualified Charitable Distributions (QCD) from our retirement accounts to ensure we obtain the best tax benefits of donating. I’ll describe why in next week’s post. Using QCD adds some added tracking: I’m substituting new QCD for money leftover from this year that we earmarked for donations. That leftover amount is then part of our SSA for next year.
3. Decide how much of the remaining needed for our upcoming SSA will come from taxable accounts and from retirement accounts. SSA is always greater than RMD, so we need to sell more than the RMD amount to get to the total. SSA is the gross amount you can safely withdraw from your portfolio for the year. Spending includes taxes you pay. You want low taxes now to net more to ENJOY now.
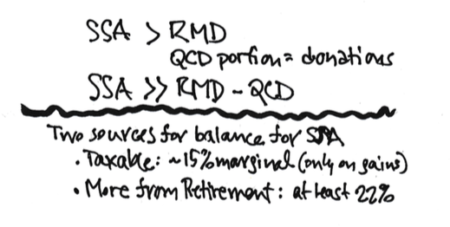
I try to get to the balance needed for our total SSA from our taxable account. The 15% tax on the capital gains portion is less than the 22% or more income tax rate on added withdrawals from our retirement accounts. (The obvious exception is withdrawals from a Roth IRA account. Patti and I have no Roth IRA accounts. If you do, you already paid income tax when you invested into your Roth IRA. You don’t pay tax again when you withdraw. To net the most to ENJOY now, you would withdraw first from Roth IRAs.)
When I sell taxable securities, I first sell the shares with highest cost basis and therefore lowest capital gains. My account is at Fidelity, and a tool there arranges all my holdings by highest cost basis to lowest. I then sell the specific, high cost shares. Fidelity tracks the effect of doing that. I’m guessing your brokerage account has a very similar tool.
========
I’ve worked through these steps several years now and see that we spend more from our taxable securities than from our retirement holdings to fulfill our SSA for the upcoming year. That will continue: selling from our taxable account will always result in lower current tax than from taking a greater withdrawal from retirement accounts. At some point in time, Patti and I will essentially deplete our taxable holdings. Our portfolio will almost solely be in retirement accounts. At that time our SSA can only be filled by much greater withdrawals from our IRA accounts than we are taking now. In summary, we’re deferring high marginal taxes on added IRA withdrawals now, but that tactic will play itself out and eventually we’ll pay the piper. (In our much older years – when our appetite for travel is less – perhaps we will withdraw less than our calculated SSA.)
Conclusion: You have just two times during the year that you need to spend any time on your financial retirement plan. You could actually just make it one time, just after your calculation date. I like to get a preliminary picture in early October of what I will be doing in the first week of December. That basically means I want a temperature reading on returns so far in the year to get a sense of what will be happening to our SSA for the upcoming year. I also want to get a good estimate of how much of our 2018 SSA will be left over – the amount we can gift or donate. Patti and I decide on the details of gifts and donations now.

Snapshot of returns this year do not point to a real increase in spending for 2019
In Nest Egg Care, Part 3, I recommend that you recalculate at least every three years to see if you can increase your Safe Spending Amount (SSA) for the upcoming year. Patti and I recalculate annually. Your recalculation always leads to a greater real amount if the real returns over the past 12-months are greater than the amount you withdrew last year. The purpose of this post is to give a snapshot of returns to date if you follow the investment advice in Nest Egg Care.
Here’s the example of how returns affect your annual Safe Spending Amount (SSA). At the end of last year, Patti and I withdrew 4.75% (our Safe Spending Rate or SSR%) from our Investment Portfolio. (See Part 1 and Chapter 7, Nest Egg Care.) Therefore, if the real return for 12 months is greater than 4.75%, we’ll be able to withdraw a real increase in our upcoming Safe Spending Amount.
Since Patti and I use November 30 for our recalculation date, the proper picture for us as of September 30 is the 10-month return. Some folks I know use October 31, so they’d want to see the 11-month return. Others use December 31, so it’s a 9-month picture for them. Here are the total returns for the past 11 months; 10 months (outlined); and 9 months. I use the weights and mix that Patti and I use. (See Chapter 11.)
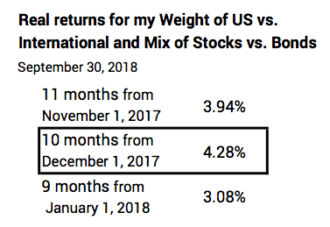
For Patti and me (10 months) the real return on our portfolio is 4.3%, and it’s a bit lower for other time periods. The basic conclusion is that we all are on track for positive returns for the year. But total return is not great enough for those of us with a greater SSR% to recalculate to a real increase in our SSA for 2019.
Your returns will vary from these depending on your weights and mix. And obviously the returns we will use for our recalculation will be affected by returns for the next few months. (This first week in October points to lower returns than these for our recalculation.)
Patti and I are okay with these returns and no real increase for the upcoming year. This year’s modest return follows two prior years that boosted our Safe Spending Amount by 20% from the amount at the start of our plan four years ago. (Our portfolio return was +32% over 2016 and 2017 – that’s the compounding of +11.3% (2016) and +19% (2017). All retirees with a nest egg are far better off now than they were then.
========
Here is a more detailed display.
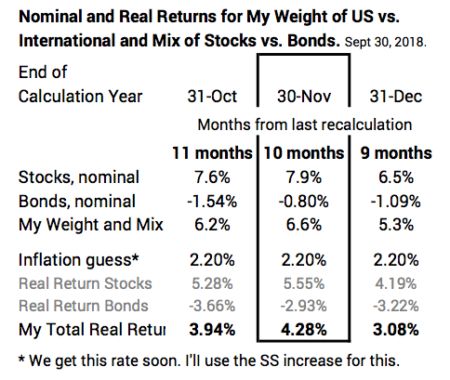
For the 10-month period stock returns are about 5.6% real return; this compares to their long run average of about 7% annual return. US stocks are ahead of the game while International stocks are in negative territory. (Last year, International stocks returned more than US Stocks.)
Bonds are our insurance for when stocks tank. Real bond returns this year are under water – about -3%; their long run average is about +2.3% return.
Conclusion: Total portfolio returns are modestly positive for the periods leading up to the 12-month returns that we use when we recalculate to see if we can increase our Safe Spending Amount for the upcoming year. Returns to date tell us we all will stick with the same real SSA we used for our 2018 spending. Our dollar amount will simply adjust for inflation in the way Social Security payments adjust. That’s fine with Patti and me after the two years in a row that led to +20% increase in our SSA.