Were you bothered by the market decline in October?
Posted on November 2, 2018
I was not. The nominal decline in my portfolio was about 5.7% in the month. Your return would have differed if your portfolio weights (US vs. International) and mix (stocks vs. bonds) differ from mine. That decline was painful to see on the display of the total value of our portfolio. That was a pretty steady decline of a lot of dollars per day and week. Why didn’t this bother me?

It didn’t bother me and should not have bothered you, because we nest eggers have a much longer view of what’s important. I keep reminding myself that daily, weekly, and monthly ups and downs are basically meaningless. Those ups and downs aren’t the correct measure of risk for us. The risk point or variability that we’re worried about is the inflection point of the hockey stick of our financial retirement plan: the number of years you picked for zero percent probability of depleting your portfolio. That was 18 years for Patti and me at the start of 2018. We know we made the correct decisions to basically lock in those 18 years. Our real risk at the point is almost non-existent: we’ve locked in those 18 years. (And we’ve basically locked in the pile of money we’ll have in the future when the sequence of return isn’t worst case.)

That inflection point (where the blade angle starts) is determined by the most horrible sequence of returns in history. Our results will always be better if we don’t ride one of those most horrible sequences – shaft length will be longer and that pile of money will be bigger. And horrible sequences were presaged or predicted by very unfavorable economic conditions that led to a very long bear market. Here are conditions that DON’T look unfavorable now.
1. Problematic inflation. It’s higher than last year, but clearly not a problem. It’s basically at its very long run average rate.
2. Tight money policy. Fed rates are higher but are not higher in attempt to squelch inflation. Real rates are about 0%.
3. Recession threat. GDP growth remains strong; the risk of near-term recession is low.
4. Investor exuberance. Indicators of bullish expectations of investors are below average.
5. High valuations. The trailing P/E of the S&P 500 was 18.1 at the end of October relative to 19.2 over the past 25 years.
We feel better when we take a longer look. Returns over the past three to five years (even ten) look more average. For reference the average real annual return for stocks is 7.1% and for bonds it’s 2.3%. (I did not inflation adjust the nominal returns shown here.)

The shortest return period I want to be concerned about is one year. I focus on the 12-month return ending November 30. That’s the portfolio return rate I use when I Recalculate to find our Safe Spending Amount for the upcoming year. (See Nest Egg Care, Part 3.) It obviously still looks likes none of us will Recalculate to an increase more than for inflation for next year.
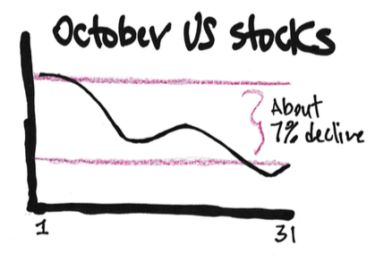
Conclusion: Stock returns in October were about -7%. Bond returns were about -.5%. So what? We nest eggers can’t get upset or excited about one-month returns. Or three-month returns or even one-year returns. Our focus is on the risk point that is much farther out on the shaft of our hockey stick – perhaps decades away. The shaft length is the number of years you picked for zero probability of depleting your portfolio, and with the right decisions (spending rate, investing cost, mix of stocks vs. bonds) you’ve eliminated the variability or risk in the number of years to that point.