What’s the tax cost of actively managed funds?
Posted on April 10, 2020
The market has declined. It’s a good time to decide if you should sell actively managed funds you may hold in your taxable account. You’d sell and take the net proceeds and buy peer index funds for a better long-term return. You have a number of factors to consider, but the recent decline means gains taxes – the big factor that sticks in the mind of most investors – are less of an issue now. This post examines a different factor. I do my best to answer the question, “What is the penalty in lower annual return from the taxes you pay on capital gains distributions from actively managed funds?” In summary, I calculate the penalty is small, about .2 percentage point penalty in return. I differ with the +one percentage point penalty that Morningstar (M*) calculates.
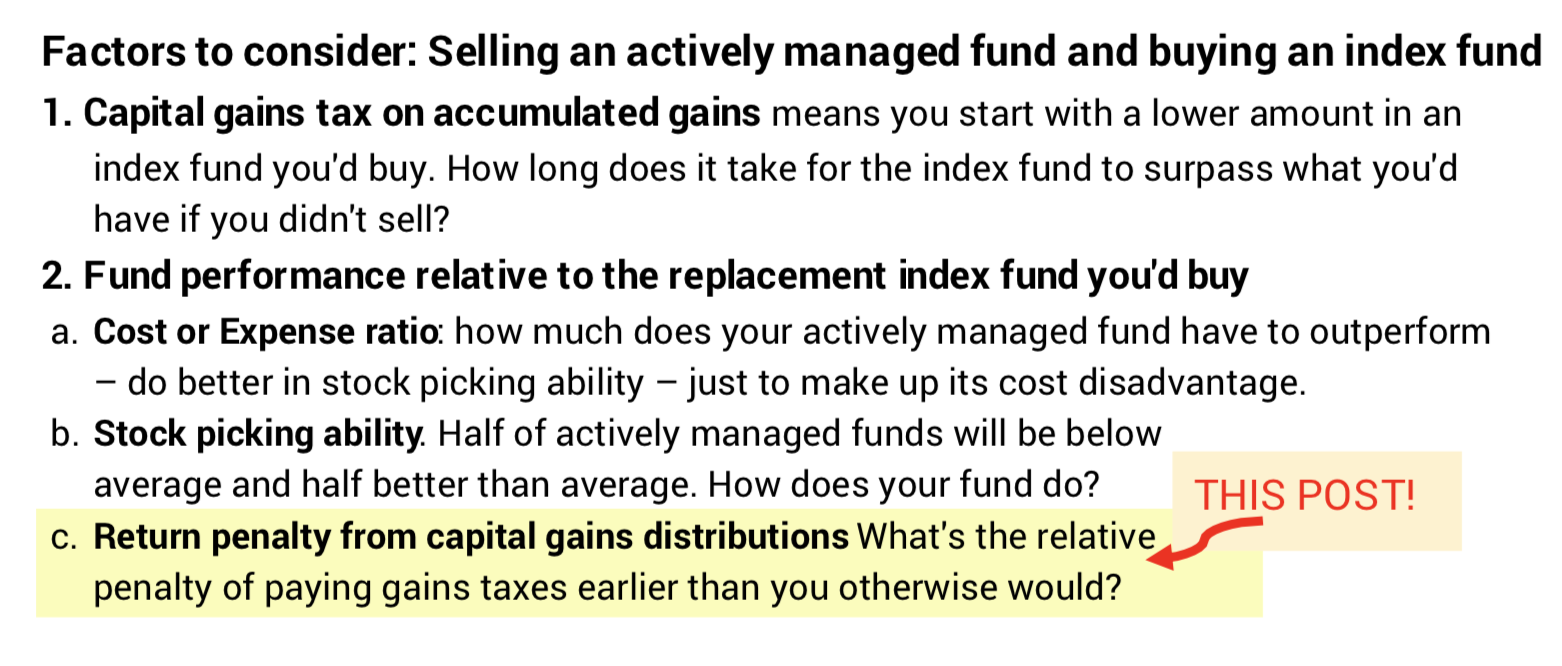
Here’s my list of the factors you’d think about in deciding to sell or hang on to an actively managed fund. This post examines the last one I list here. I’ll examine how I would prioritize funds to sell (#2a and b) next week and give you the math for #1 the following week.
I want to knock this last factor off the list. Morningstar’s calculation of this cost is high and almost makes the decision a slam dunk: SELL, SELL, SELL actively managed funds in your taxable account and buy replacement peer index funds. I wanted to understand: is this cost really as high as M* states?
You find M*’s calculation of tax cost penalty of distributions – the penalty in lower after tax return as compared to pre-tax return – on the Price page for any fund. You really want to compare the tax penalty of your actively managed fund to that of its peer index fund. for example, M* shows the tax-cost penalty for Fidelity Contrafund (FCNTX), the largest actively managed fund in the US, is about 1.5 percentage points per year while the tax-cost penalty of its peer index fund, VIGAX, is about .3 percentage points per year.
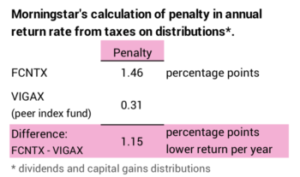
The 1.2 percentage point difference is a HUGE penalty. It’s nearly 15% of the expected, 7.1% real return rate for stocks (1.15/7.1). The compound difference in returns adds up to a BIG HIT in dollars in your hands when you ultimately sell for your spending. Is it really that big?
== Total Pre-Tax Return: Dividends reinvested + price change ==
We need to start here to get our bearings. The total pre-tax return on a security you hold includes 1) dividends that you reinvest on the day you receive them and 2) capital appreciation from the change in price.
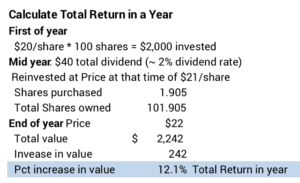
Example: you buy 100 shares of a mutual fund at $20 per share = $2,000. In the middle of the year you receive $40 dividends that you immediately reinvest when the price has risen to $21/share. You buy 1.905 shares ($40/$21). (You can look at your monthly brokerage statement and see that dividends you receive are reinvested the day you receive them.) You now own 101.905 shares. At the end of the year, price has risen to $22 per share. The total value of your holding is now $2,242; your gain in the year is $242. Your total return rate is 12.1% ($242/$2,000): you earned 10% from price; 2% from dividends; and .1% from the price gain from when you received the dividend.
== All funds (and ETFs) have lower after-tax return ==
When you hold a security in your taxable account, your after-tax return is always less than the stated pre-tax return for that security. You pay taxes on dividends; you’re reinvesting, in effect, less of each dividend. You lose a little growth in your investment from paying taxes earlier than you otherwise would. You also pay gains tax when you ultimately sell a stock mutual fund or ETF to get the cash you need for spending.
== Index funds distribute ~solely dividends ==
Index funds solely (well, almost solely) pay out the dividends they collect from the securities they hold, and you pay taxes on your share that they report to you at the end of each year. An index fund like VTSAX rarely sells the securities it owns. M* states VTSAX has 3% annual portfolio turnover meaning it hold on to its typical a security for 33 years. It’s only paid dividends for the last 19 years and no capital gains distributions.
== Gains distributions: the added tax penalty
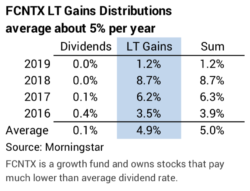
Why do actively managed funds generate gains distributions while index funds don’t? Actively managed funds are constantly seeking to improve their portfolio to beat other actively managed funds and to overcome their inherent cost disadvantage to beat the market. M* states FCNTX has portfolio turnover of 26%; you could think of this as completely changing the stocks it holds every four years.
When a fund sells securities to buy others it thinks are better, it records the net gain from all its transactions in a year and then reports these capital gains to you – distributes them to you – and you pay the tax on these gains. This chart shows that FCNTX annually distributes about 5% of the share value as gains distributions.
Your total return does not change from these distributions. You are simply paying taxes earlier than you would otherwise. The impact of paying these taxes earlier is not straightforward. You’re paying added taxes now. Your cost basis of your investment increases. You’ll report less gain and pay less tax when you finally sell to get the cash for your spending.
== A spreadsheet tells the story: 10 years ==
I could not follow the math that M* uses to calculate the return penalty from capital gains distributions. I found I needed to build this detailed spreadsheet to understand the tax effect of dividends and capital gains distributions over the whole cycle of ownership and final sale. I think my approach is the correct way to look at this. In summary I calculate .15 percentage point per year return penalty from owning the typical actively managed. That’s roughly one-eighth the penalty that M* would calculate.
I describe the key assumptions at the top of the spreadsheet. The basic assumption is 7% real rate of return per year, and I ignore the effect of inflation. The result for each year assumes you held your investment for those number of years and sold it at the end of the year. Here’s the comparison of returns for an investment held ten years. The key comparison is Case 3 vs. Base Case 2. That’s the .15 percentage point difference per year.
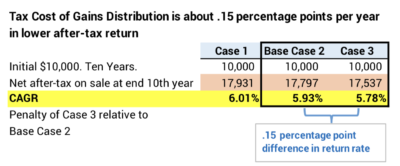
Case 1. This case has the 7% real return per year solely from price appreciation. This is best possible case of net return after taxes. No dividends. No capital gains distributions. You don’t lose any growth of your investment from paying on-going taxes. Your investment compounds at a 7% rate. You only pay tax on the final sale to get cash you want for your spending.
Base Case 2: This case has the 7% return as 2% from annual the dividend rate and 5% from price appreciation. I make this the Base Case, since the assumption in Case 1 of no dividends is not realistic. The average dividend rate for all stocks is about 2%. You can think of this investment as a broad-based, stock index fund which has no capital gains distribution just like VTSAX. After selling at the end of ten years, the after-tax return is 5.93% per year.
Case 3: This is the same dividend rate as the Base Case with added 4% capital gains distributions each year. The annual 7% pre-tax return is the same, but the annual taxes you pay triple: tax on 2% dividends + 4% gains distributions. You lose more growth potential from the greater taxes paid but your cost basis increases more. After selling at the end of ten years, the after-tax return is 5.78% per year. This case has lower after tax return of .15 percentage point per year after ten years as compared to the base case. That’s the typical, added tax cost of capital gains distributions.
Conclusion: This is a good time to consider selling actively managed funds that you may have held for years in your taxable account. You have a number of things to consider in this decision, and one is the penalty you pay in lower after-tax return from the on-going taxes you pay on capital gains distributions from actively managed funds. Morningstar calculates this cost as roughly one percentage point per year in the example I used in this post – and much more than this for some funds. That’s BIG. That would tilt you to sell, sell, sell your actively managed funds and replace them with index funds. I calculate this penalty in return is much smaller – about .15 percentage point cost per year. That’s a minor consideration in your decision to sell an actively managed fund.