What happened to inflation? Where is it?
Posted on December 19, 2025

Wow! Inflation reported for October + November was REALLY LOW. We have not had two months with inflation this low in the last +five years.
I display a table and graphs that I use to follow the trends in inflation. One that I usually include has not been updated since September.

Details:
The two most widely-reported measures of inflation are Seasonally-adjusted inflation and Core inflation.
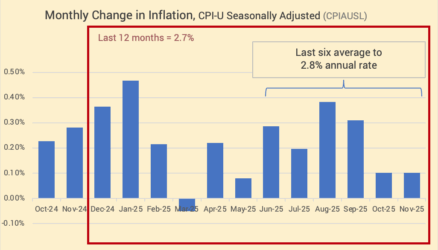
Seasonally-adjusted inflation is the most widely reported measure of inflation. Oct + Nov averaged inflation of 0.10% per month. Inflation for the last six months was at 2.7% annual rate. This is the same as the 12-month inflation rate.
Core inflation excludes volatile energy and food components. Oct + Nov averaged 0.08%. The last six months ran at 2.6% inflation. This is the same as the 12-month inflation rate.

Personal Consumption Expenditures (PCE) excluding Food and Energy is the measure of inflation that the Federal Reserve Board favors. It’s similar to Core inflation, but tends to run a bit lower over time. We have no updates on Oct + Nov. This data is through September. One would expect Oct + Nov to be similar to the two months for core inflation.

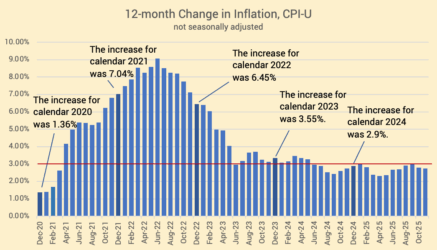
== History of 12-month inflation rates ==
Full-year inflation measured by CPI-U was 2.7%. That’s 0.1% greater than last month.
I add a graph that shows this Oct and Nov averaged to -0.10% and replaced very low months of a year ago. December of last year was also very low.

== Producer’s Price Index ==
We don’t have data for Oct or Nov. No graph.
== Services ==
Inflation for services for Oct and Nov was low. The last six months average to 2.8% annual rate. The 12-month rate is 3.0%.

Conclusion: The inflation measures released this week for October and November were much lower than expected. We have not seen two months with inflation this low for +five years. Inflation runs as about 2.7%. similar to the rate for the past year or so.