Once you’ve LOCKED IN SAFETY, Maximize the Pile of Money
Posted on August 17, 2018

The last post shows that you LOCK IN SAFETY – the number of years you want with no chance of depleting a portfolio – with three key decisions: Spending Rate, Investing Cost, and Mix of stocks vs. bonds. Different decisions on those three can lead to the EXACT SAME LEVEL of safety. As reference, Patti and I adopted a safety level of at the end of 2014 that was no chance of depleting our portfolio for 19 years. (See Nest Egg Care (NEC), Chapters 2, 3, and 4.) (Refer here for a glossary of terms.)
But different decisions will lead to different Piles of Money – the amount you’d accumulate in a future year if you rode a more normal or expected sequence of returns.* (You’ll see below that the Pile of Money for Patti and me is about $3,000 relative to a $1,000 initial portfolio.) The purpose of this post is to explain how I got the to Piles of Money displayed in last week’s post.
========
Two weeks ago I independently verified the SSR% I originally got from FIRECalc by buiding a spreadsheet using the most horrible sequence of stock and bond returns that I found. My spreadsheet confirmed FIRECalc’s results. It confirmed 19 years of no chance for depletion for Patti and me at the start of our plan.
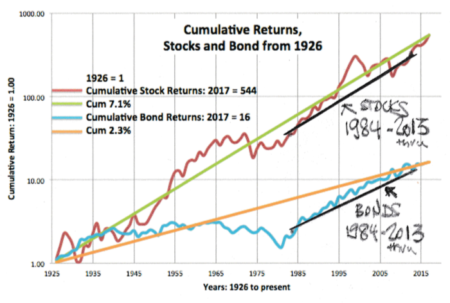
My method here also uses one sample sequence for the same spreadsheet. The return sequence is different. I tried to pick the 30-year return sequence that was average. (In hindsight, perhaps I should have focused on a 20-year sequence.) That meant I looked for a sequence with the starting and ending points for stocks and for bonds that most closely paralleled their long-term trend line. That’s the 7% per year real return line for stocks and 2.3% line for bonds. I eyeballed and settled on 1984 as the start year. You can see my handiwork here. (It’s not so easy to find them both marching along their trend lines!)
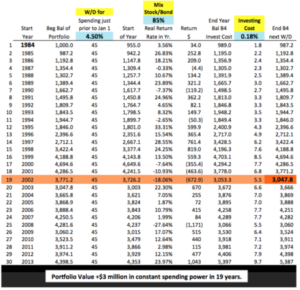
I then entered the return sequences and the spreadsheet calculates year-by-year portfolio values. Again, for our plan inputs (those for Patti and me), the Pile of Money at the end of the 19th year is about three times the amount we started with. That’s stated in constant spending power. (Full size display here.)
That magnitude of increase (and the increase in just a few years) tells us we can Recalculate during retirement: (See Part 3, NEC.) My recalculations based on returns for 2015, 2016, and 2017 mean Patti and I can now safely spend about 20% more per year than for the first year of our plan: our 2015 spending was $44,000 per year per starting $1 million Investment Portfolio; our 2018 spending is $54,000.
========
FIRECalc gets to the value of the Pile of Money by averaging portfolio values in a future year for all the sequences it builds. For example, it averages the ending values for as many as 129 19-year sequences . That method is more thorough than mine. And FIRECalc’s average is a lot less than from my choice of the 1984 sequence. But my crude method and FIRECalc’s lead to the exact same conclusions and decisions for your plan.
Conclusion: Assuming you ride the most horrible sequence of return we can anticipate, a Retirement Withdrawal Calculator will find the Safe Spending Rate (SSR%) that gives you the number of years you want for no chance of depleting. I trust FIRECalc for this task. Different decisions for Spending Rate, Investing Cost, and Mix of stocks vs. bonds can give you the exact same level of safety.
With those same inputs, you will have much more money in the future if you ride a sequence that is not most horrible. That’s the Pile of Money. You can alter your three key decisions (maintaining the same level of safety) to maximize the Pile of Money. Do that!
* To be more precise, the Pile of Money is calculated assuming you never change your decisions on Spending Rate, Investing Cost, and Mix during retirement.