How is the Social Security COLA calculated?
Posted on September 25, 2020

The purpose of this post is to explain how Social Security (SS) calculates the Cost of Living Adjustment – COLA – each year. Your SS benefit increases by the percentage COLA to maintain the same spending power over time. I also use the percentage COLA to calculate how my Investment Portfolio (Chapter 1, Nest Egg Care) changed in terms of real spending power over the past year. We nest eggers need to do that to properly calculate our Safe Spending Amount (SSA) for the upcoming spending year (Chapters 2 and 9, Nest Egg Care [NEC]). Will our SSA just adjust for COLA or will it increase in real spending power?
I wondered a couple of things this week: Does SS’s COLA use the most common index of inflation? Does the COLA accurately reflect the spending patterns of retirees? How exactly does SS calculate COLA? Since they’ll announce the increase for 2021 in early October, what are we waiting for now for their calculation? How much might COLA be for 2021?
== CPI-W ==
The Bureau of Labor Statistics (BLS) monthly gathers measures of price changes for many components of consumer spending – 17 components in total. It then assembles indices of consumer spending based on spending patterns of different groups of consumers. You can see a recent calculation and the weights – relative importance – of the components for one index of inflation here. This BLS page shows monthly changes from January 2010 for the two most widely indices.
• The most common measure of inflation is CPI-U – the Consumer Price Index that reflects purchasing patterns of all Urban Consumers. “Urban” includes places of more than 2,500 residents, and the index covers the purchasing patterns of about 90% of the US population.
• By law, the SS COLA is calculated based on the annual change in CPI-W – the Consumer Price Index for Urban Wage Earners and Clerical Workers. This index reflects the slightly different spending habits of the population of wage earners relative to the all-urban consumer population. I don’t know the history of why CPI-W was selected rather than CPI-U. BLS assembled an experimental index specifically for folks over age 65 – CPI-E, and over the years, it’s increased by more than CPI-W. But the statute says SS must stick with CPI-W.
== CPI-W < CPI-U ==
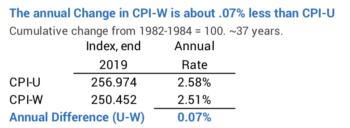
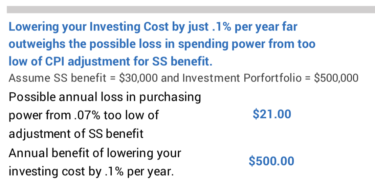
Inflation as measured by the CPI-W is slightly less than that measured by CPI-U. The BLS table shows that from the initial start date (the average over 1982-1984), the CPI-U accumulated to 256.974 at the end of 2019 while CPI-W accumulated to 250.452. The average compound rate of CPI-U has been 2.58% while it’s 2.51% for CPI-W – an average difference of .07 percentage point per year. That is a tiny difference the total dollar difference for those retirees with a nest egg. Folks with a nest egg will keep far more dollars of spending power if they lower their Investing Cost – the weighted expense ratio on the securities they own – by .1%; that’s pretty easy to do for most all investors.
== The calculation of COLA ==
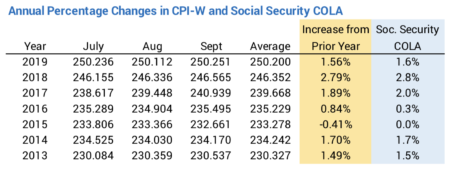
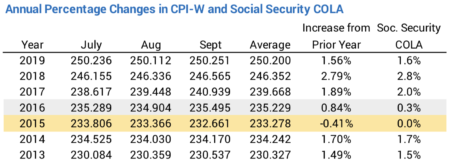
• The calculation of COLA averages the inflation indices for the third quarter of the year – July, August, and September – and compares that to the average for the same period of the prior year. This table shows the monthly values for CPI-W, the annual percentage change in CPI-W, and COLA for the last seven years.
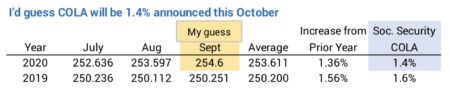
We are waiting for the September number for CPI-W to complete to get the average for this past quarter. BLS publishes a calendar and will announce September CPI on October 13 this year. SS will announce COLA shortly thereafter. When I plug in my guess for CPI for September, I get that COLA for 2021 will be 1.4%. A small change from the value I have for September would mean COLA would be 1.3%.
• COLA is rounded to the nearest one-tenth percent. COLA rounded up from CPI-W in 2018 and 2019, meaning that COLA over the two years was slightly greater than the increase of CPI-W over those two years. Over the years, the rounding up and rounding down will even out. COLA will closely track CPI-W.
• COLA can never go below 0%. Your gross SS benefit never declines. The 12-month period ending September, 2015 was a period of deflation. $1 had greater spending power at the end of that period than at the beginning. To track perfectly with the change in spending power, COLA should have declined, but the COLA for that year was 0%.
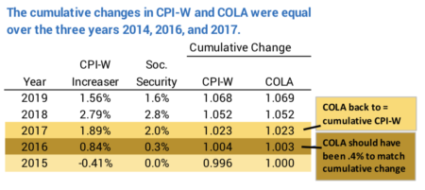
You can see how SS accounted for that in the next two years. In 2016 CPI-W increased by .84% while COLA increased by .3%. The attempt is to keep cumulative COLA and CPI-W on track. My math shows that was not quite the correct math: the change in COLA should have been .4% in 2016 to equal the cumulative change for the two years. In 2017, however, COLA was 2.0% vs. the change in CPI-W of 1.9%. That COLA increase got the cumulative change of CPI-W and COLA back on track. I’m not sure why it took that extra year for COLA to track accurately.
Conclusion: Your gross Social Security benefits adjust for the effect of inflation to maintain the same real spending power of your benefit over time. (We nest eggers at least adjust our SSA for inflation each year for the same reason.) By statute, SS uses an inflation index CPI-W, which is slightly different than the most commonly used index, CPI-U. The calculation each year is based on the change in inflation for the third quarter of the year (July, August and September) from the same quarter of the prior year. COLA is rounded to the nearest .1%. Some years it rounds up and in others it rounds down. Over time it accurately tracks with CPI-W.