Does the start of the worst sequence of returns start exactly in January 1969?
Posted on June 10, 2022

FIRECalc builds many historical sequences of stock and bond returns in history and displays how a portfolio will fare over time for all the sequences. Nest Egg Care uses THE Most Harmful sequence as the baseline assumption for determining a Safe Spending Rate in retirement – the rate that has Zero Chance of depleting a portfolio for the number of years you pick. FIRECalc builds its sequences to test using annual, calendar year return. This post examines the option of using an alternative start date for the test sequences of return, say, the 12-month returns starting on February 1, not January 1. This post finds that THE Most Harmful sequence of return started on January 1, 1969. Not a bit earlier or a bit later. This means THE Most Harmful sequence of return that one finds from FIRECalc is, indeed, THE Most Harmful sequence in history. Trust FIRECalc and the Safe Spending Rates displayed in Nest Egg Care.
== The question ==
I examined THE 1969 Most Harmful sequence in history in greater detail. That sequence applies the greatest stress on a porfolio for all periods greater than ten years. A portfolio will decline to its lowest value over time on that sequence. The 1969 sequence is worse than the one that starts in 1968. It’s worse than the sequence that starts in 1970. But should we be using calendar year returns? Might a different start date earlier in 1968 or later in 1969 result in a more harmful sequence of 12-month returns and therefore a lower Safe Spending Rate (SSR%) that one would find by using FIRECalc or that I display in Nest Egg Care, Graph 2-4 and Appendix D? This seems to be a small issue, but I find that a lower the first 12-month return has a big effect on our calculation of Safe Spending Rate, even if the subsequent 12-month returns are better.
== Shiller data ==
FIRECalc builds its sequences of returns using data for stock and bond returns published by Robert Shiller, a winner of the Nobel Prize. You download the data series from the Yale site; it’s a big spreadsheet of returns for the S&P 500 and 10-year US government bonds. It displays monthly and cumulative returns since January 1, 1871. Wow! His choice of stock and bond returns are appropriate for our planning, and his data is the only source I find for returns prior to 1926.
FIRECalc builds sequences of return using calendar year returns that it obtains from the Shiller data. It builds and tests 132 20-year return sequences as an example. (We can separately examine 19 sequences that don’t run a full 20 years.)
FIRECalc did not have to use calendar year returns. Since Shiller’s spreadsheet displays the monthly returns for stocks and for bonds, FIRECalc could have tested all 132 20-year sequences starting with February 1871; all 132 sequences starting with March 1, 1871. And so forth. Rather than testing 132 20-year sequences of return, it could have tested 1,584 sequences (12 times 132)! One could find that THE Most Harmful sequence is different; it may not align with the one we find using calendar year returns.
I examine all the optional starts of sequences on before and after January 1, 1969. Might THE Most Harmful sequence start in a different month?
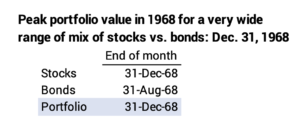
1. I examine the detail of monthly returns leading up to January 1, 1969. The annual return for stocks in 1968 was 10% and -1.5% for bonds. Perhaps, though, the peak of portfolio value was early in 1968 and then it declined very steeply the balance of the year. Perhaps stocks first rose 20% and then declined by roughly 10% for the total year return of 10%. That could mean the first 12-month return from that peak was worse than the -16.8% for calendar 1969.
What’s the data tell us? The data show that a portfolio peaks on December 31, 1968. It does not have a peak in an earlier month. See here for the detail. THE Most Harmful sequence of return did not start earlier than January 1, 1969.

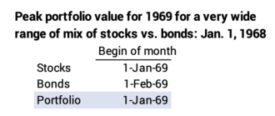
2. I examine the detail of monthly returns after January 1, 1969; the calendar year return for stocks was -16.8% and it was -10.5% for bonds. Again, perhaps the start of the year was good and the peak for that year came later than January 1. That would likely mean the 12-month return from the later start and steeper decline was worse than -16.8% for stocks.
What’s the data tell us? The peak portfolio value for 1969 was January 1 and not a later month. FIRECalc hit it on the nose: THE Most Harmful sequence of returns in history started in January 1969.

Conclusion: January 1969 is the start of THE Most Harmful sequence of 12-month returns in history. The start of the THE Most Horrible sequence isn’t a few months earlier or a few months later. We can trust the results from FIRECalc: it’s use of calendar year returns is correct. We can also trust the Safe Spending Rates (SSR%s) that I show in Nest Egg Care.