How much was June’s DEFLATION?
Posted on July 17, 2026
DEFLATION! Inflation was below 0% in June. Inflation for the most popular measure was -0.42% in June. This compares to +0.42% in May. On a 12-month basis, Core Inflation, the measure nearest to the one the Fed favors, also was below 0% for June; inflation ran at 2.6% for the last 12 months. The outlook for our SS increase is much lower than I predicted in this post. Your portfolio’s real return is better than I estimated in this post.
I display a table and graphs that I use to follow the trends in inflation.
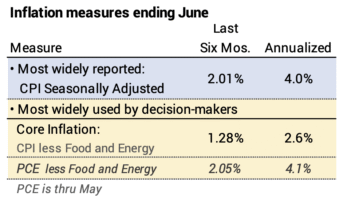
Details:
The two most widely-reported measures of inflation are Seasonally-adjusted inflation and Core inflation.
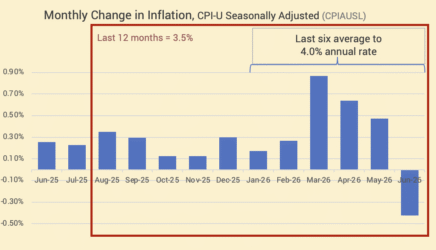
Seasonally-adjusted inflation is the most widely reported measure of inflation. June inflation was -0.42%. The decline is primarily from energy. The six-month rate is 4.0%, and the 12-montn rate is 3.5%.
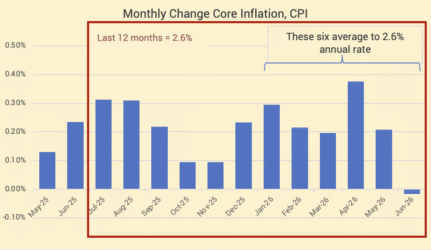
Core inflation excludes volatile energy and food components. June was a slight decline. The last time we had a month of deflation was May 2020. The six-month rate runs at 2.6% inflation, the same as the 12-month rate.
Personal Consumption Expenditures (PCE) excluding Food and Energy is the measure of inflation that the Federal Reserve Board favors. The graph shows data ending May. We get the data for June at the end of this month. The measure has been running about one percentage point greater than core inflation. It usually shows lower inflation. The last six months average 4.1% inflation and the last year was 3.4%.

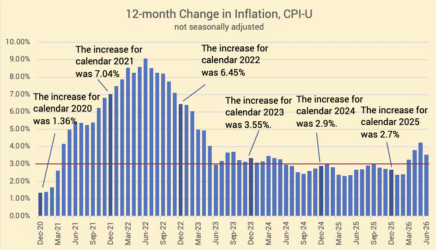
== History of 12-month inflation rates ==
Full-year inflation measured by CPI-U (not seasonally adjusted) fell to 3.5% from 4.3% last month.
== Producer’s Price Index ==
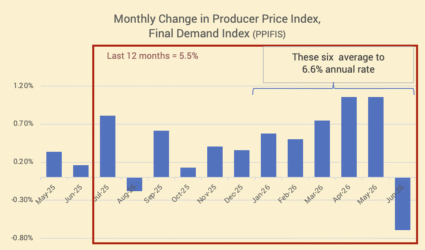
The PPI fell in June. The last six months run at 6.6% annual rate. The 12-month rate is 5.5%.
== Services ==
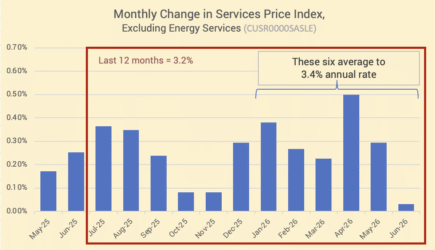
Inflation for services increased slightly in June. The rate for the last six months average is 3.4% annual rate. The 12-month rate is 3.2 %.
== Wage Growth ==
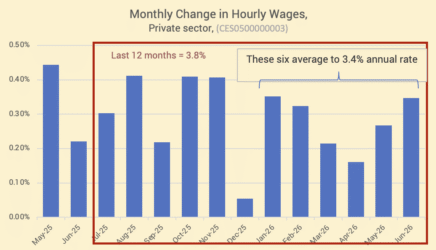
Wage growth averaged 3.8% over the past year. That’s slightly better than the 3.5% increase in the CPI.
== Inflation measure for SS COLA ==
Social Security uses the measure CPI-W to calculate COLA. The calcuation is the average for the next three month compared to same three month’s last year. My last look showed we were on track for 4.6% COLA. We’re on a much lower track now.
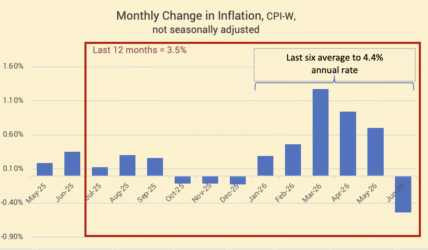
== Greater real portfolio return ==
I use SS’s measure of inflation to judge the real performance of my portfolio. The lower track for inflation means a greater real return and greater real increase in our Safe Spending Amount for 2027.
Conclusion: Inflation data released this week showed deflation for June. Past year inflation for the CPI dropped to 3.5% from 4.3%. The inflation measure the Fed favors does not include food and energy and is running at about 4.1% annual rate, but this is through May.
SS COLA looks to be lower than I previously thought. The year-to-date real return on your portfolio is greater than I previously thought.