When can you expect a 15% increase in your Safe Spending Amount?
Posted on October 23, 2020
Let’s assume you’re just starting your retirement. Following the steps in Nest Egg Care (NEC), you calculate your first Safe Spending Amount (SSA). (See Chapter 2, NEC.) That’s what you’ll withdraw right before the first of the year for your spending that year. That amount is the worst it will ever be because it assumes you are riding on the Most Horrible sequence of returns in history. Your SSA can only get better because it’s almost certain that you will not experience Most Horrible.
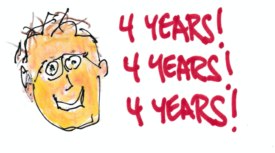
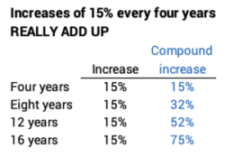
You wonder, though, “When might I expect it to get better? How many years might it take to calculate to a significantly greater SSA?” The purpose of this post is to answer the question, “At expected market returns, how many years would it take for my Safe Spending Amount to calculate to +15% increase in real spending power?” I show in this post, that you should expect to see a 15% real increase in your SSA roughly every four years. That’s +30% in eight years. +50% in 12.
This is an important question and answer. You want to plant in your head that you can expect a much better retirement – a significantly greater SSA – in NOT THAT MANY YEARS. If you’ve implemented your retirement plan following the recommendations in NEC, you have seen this over the past several years: your SSA has increased by +15%.
Fifteen percent more is a big deal. Patti and I were happy with our initial SSA, but when we reached the point of +15% greater SSA, I found a new sense of well-being and comfort. I knew that Patti and I will REALLY, REALLY NEVER RUN OUT OF MONEY. We knew that we had More-Than-Enough (See Chapter 10, NEC) and could think about how our money might best help others.
== Two factors drive increases in your SSA ==
The calculation that tells you if your SSA will increase in real spending power is driven by two factors. (See Chapters 2 and 9, NEC and this post that discusses our calculation in December 2017.) This discussion follows this sheet I use for our calculation of our SSA.
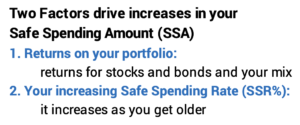
Factor 1. Your annual portfolio returns. Your portfolio return is driven by market returns for stocks and bonds and your mix of stocks vs. bonds. You calculate a greater real SSA every time your portfolio returns earn back more money than you had when you withdrew your SSA.
Example: I withdrew 4.40% from our Investment Portfolio at the start of our plan in December 2014. That was our Safe Spending Rate (SSR%) based on Patti’s age = 67. To put the 4.40% into dollars, let’s assume an initial $1 million Investment Portfolio. 4.40% translates to $44,000, our Safe Spending Amount (SSA). [You then use your Multiplier to get the actual dollar amount for your SSA. (See Chapter 1, NEC).] I sold securities to get our SSA into cash at the end of December for all our spending for 2015.
Here’s the simple math: I needed a real portfolio return greater than 4.60% in 2015 to earn back what I withdrew before the start of the year. If earned more than this I’d have more in real spending power at the end of 2015 than I had right before our first withdrawal in 2014. I would have More-Than-Enough for our current SSA, and I’d calculate to a real increase in SSA for the upcoming year.
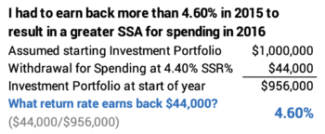
The real return on our portfolio for 2015 was -1.2%. We clearly did not earn back what we withdrew. That math won’t work to calculate to a greater SSA.
I need to wait another year. Would returns be good enough to recalculate to a greater SSA then? The math works out that we had to earn back +11% real return in 2016. I had to make up for the December 2014 withdrawal, the decline in 2015, and the December 2015 withdrawal. I had to earn back more than $99,500 to exceed my starting $1 million.

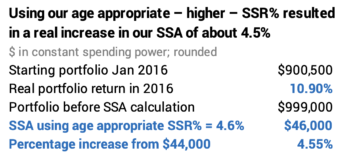
Returns for 2015 didn’t quite make it. Our portfolio return was 10.9% in 2016: just .1% short and to a total of $999,000 (rounded). We could not calculate to a real increase in SSA using our initial SSR% of 4.40%.
Factor 2. Your applicable Safe Spending Rate (SSR%) increases with age. This factor works in your favor in the calculation of your SSA. This factor means you really don’t have to earn back all that you withdraw for spending to calculate to a greater SSA.
Example: I really didn’t need to earn back to surpass or $1 million real portfolio value before increasing our SSA. That was because our applicable SSR% at the end of 2016 – since we were two years older and have a shorter life expectancy – increased to 4.60%. I applied 4.60% to our $999,000 and calculate to an SSA of ~$46,000. That is a ~4.5% real increase in our SSA and is solely due to this factor.
== How many years to +15% SSA? ==
I can calculate how many years it takes to earn back enough to generate a real increase of +15% in SSA. I make a few assumptions for the calculation below:
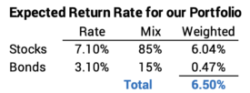
1) I used the expected return rates for stocks of 7.1% real return and bonds of 3.1% real return. You can see the source of these returns here.
2) I assume the portfolio mix that Patti and I use. That’s 85% stocks and 15% bonds: this translates at an expected return rate of 6.50%. (This would be 6.1% at a mix of 75%-25% and the final answer will be one year longer than I calculate.)
3) I assume the SSR% increases by 5% over the years. This is simplifies the calculation. (SSR% increased by ~10% for Patti and me in five years: from 4.40% to 4.85%.)
== It’s about four years =
The table below shows that takes about four years for a 15% increase in your SSA.
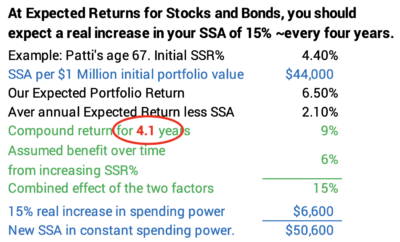
Admittedly this is a simplified calculation, but four years is about right for all ages at the start of your retirement plan. Patti’s age 67 at the start of our plan determined our SSR% = 4.40%. (See Graph 2-4 and Appendix D, NEC). Someone younger starts with a lower SSR%. The difference from expected portfolio returns is greater. But SSR% increases more slowly and that benefit is less.
Someone older would have a greater SSR%. The difference from expected annual returns is less. But the SSR% increases more rapidly and that benefit is greater.
Restated: you could expect a 15% real increase in your SSA about every four years! With typical returns, Patti and I should expect a 15% real increase in our SSA every four or so years. It’s increased by 22% in real spending power, but four years from now Patti and I should expect our SSA to grow in real spending power by another 15%. And another 15% in another four years after that and so on. Oh, boy! Just somewhat normal returns would be very good.
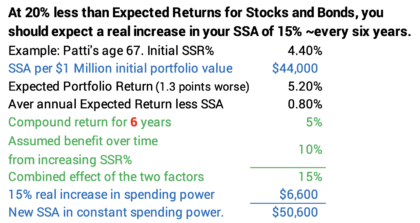
== Or maybe its six years ==
I calculate that it’s six years if returns are 20% worse than expected returns. That means lower return and compound growth in our portfolio over time. Because it’s going to be more years to calculate to 15%, I used 10% as the percentage increase in SSR%. That’s a pretty good assumption: Patti and I see a ~20% increase in our SSR% in eight years – from 4.40% to 5.30%.
Conclusion: You should have a sense of optimism about your financial retirement plan. Odds are your Safe Spending Amount (SSA) will be much greater over time. I think you will feel much better about your financial retirement plan when you hit +15% real increase in your SSA. At expected real returns –long-run average returns – for stocks and bonds, you could expect a 15% real increase in your SSA every four years. That compounds from your start to 32% four years later. Then to +50% in another four years. Even if returns are somewhat substandard, you can expect 15% real increase in roughly every six years.