What’s the length of your Retirement Period?
Posted on February 5, 2021

We retirees want to spend to ENJOY retirement, but we are governed as to how much is safe to spend by our over-riding concern: DON’T RUN OUT OF MONEY. Nest Egg Care (NEC) argues that you start your plan by choosing a number of years you want for ZERO CHANCE of depleting your portfolio. I’d consider those years as your “Retirement Period,” and the number of years you pick relate to your life expectancy. The purpose of this post is show how you can use the Social Security Life Expectancy calculator to pick the number of ZERO CHANCE years that will lead you to your annual Safe Spending Amount (SSA) .
== ZERO CHANCE years and Safe Spending Rate (SSR%) ==
I discuss the logic of how you pick the number of years you want for ZERO CHANCE of depleting your portfolio in Chapters 2 and 3, NEC. A plot of the risk of depleting a portfolio looks like a hockey stick. You have many years of ZERO CHANCE of depleting your portfolio; that’s the shaft length of the hockey stick. You have a rising risk in the years thereafter – typically when you are in your late 80s and 90s; that’s the blade of the hockey stick. NEC leads you through the decisions as to How Much to Spend and How to Invest to LOCK IN the shape of your hockey stick and describes how to lengthen the shaft of your stick if you need to or want to during retirement.

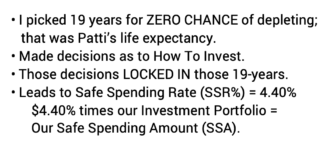
Example: at the start of our plan, my choice for ZERO CHANCE years – the shaft length of the hockey stick for Patti and me – was 19 years; that’s the life expectancy I got for Patti from the calculator I used at the time. With our decisions as to How To Invest, I knew that our Safe Spending Rate (SSR%) was 4.40%. (See Chapter 2, NEC). Our 4.40% times our Investment Portfolio value in December 2014 gave us our our annual Safe Spending Amount (SSA) for 2015.
We’re older now and Patti’s life expectancy is fewer years, and we play with a hockey stick with shaft length of 15 years. We see no reason to lengthen that becuase we now have LOTS of flexibility to lengthen it whenever we want. 15 years equates to 4.85% SSR%. About 10% more than at the start of our plan. Bigger SSR% = MORE $$$ TO ENJOY.
For this post I’m assuming you made the same decision I did. You have picked 1) your life expectancy; or 2) the life expectancy of your spouse if his/her life expectancy years is more than yours as the number of years you want for ZERO CHANCE of depleting your portfolio.
== The Social Security Life Expectancy calculator ==
When I wrote Nest Egg Care, I used the Vanguard Probability of Living Calculator – it’s no longer available – to find our life expectancies and to draw the graphs of our probability of being alive in any future year (See Chapter 3 and Appendix E, NEC). I now use the Social Security (SS) Life Expectancy Calculator to find Patti’s life expectancy as of each November 30. That’s the date I use to calculate our SSA for the upcoming calendar year.
As I tuned up my calculation sheet that I use every November 30, I found the SS calculator gives a different answer for Patti’s life expectancy than I got from the Vanguard calculator. The Vanguard calculator said that Patti’s life expectancy at her age this November 30 was 14 years. The SS calculator says it’s 15 years (rounding 14.9 years). The SS Calculator gives one added year of life expectancy.

I’m not sure why the Vanguard calculator gave one year less life expectancy than the SS calculator does now. Life expectancy calculators are driven by life expectancy tables and perhaps the most recent tables reflect slightly longer life expectancy. Example: the IRS used updated life expectancy tables that reflected almost two years longer life expectancies as the basis for the schedule for Required Minimum Distributions.
== Finding Life Expectancy on November 30 ==
Reader Ben sent me an email and said, in essence: “My birthday is in early June. I’m going to use November 30 as my calculation date. I’m almost exactly six months from that date. Do I round my age up or down for the calculation? My rounding will have an effect on the SSR% I test each year to see if I can increase my SSA.” (See Chapter 9, NEC.) The answer to Ben’s question shows how I now use the SS calculator.
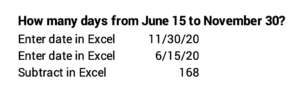
I’ll assume Ben’s birthday is June 15, 1955. I can use Excel and find that June 15 is 168 days from November 30. Last November 30, Ben was 65 years and 168 days old.
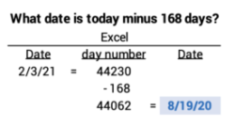
What’s the life expectancy for a male age 65 and 168 days old? I can find that from the SS calculator, but I have to fiddle using today’s date. I’ll use today’s date, February 3, as I write this. I convert that to the number format in Excel and today’s date is 44230. I subtract 168 to find day 44062 in Excel, and then I put that in date format to find that was 8/19/20.
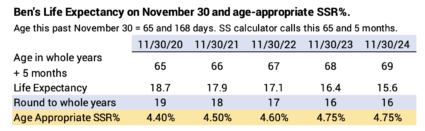
I then use 8/19/55 as Ben’s birthday and find life expectancy is 18.7 years. That was his life expectancy last November 30. I can repeat using 8/19/54 to find his life expectancy next November 30 = 17.9 years. And so forth. Ben can build a table for the next five or more years, rounding his life expectancy to whole years. The schedule I built adds the age-appropriate SSR% for each year from Appendix D.

== I adjusted our November 30 calculation sheet ==
I followed this same approach to update Patti’s life expectancy and the age-appropriate SSR% I should be testing each year. I mentioned this change here. I repeated her life expectancy as 15 years; I previously had it at 14 years. The result is that I used 4.85% for our calculation of SSA this last November 30 and not 5.05% that I previously planned to use.
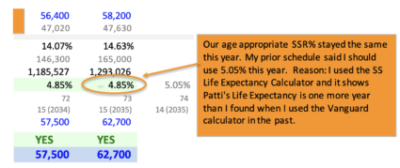
Since our portfolio return for the 12 months ending November 30 was far greater that the percentage we withdrew last year, Patti and I clearly were going to have a real increase in our SSA. Using 4.85%, our increase in our SSA was 9% – from $57,500 to $62,700; that’s stated in terms of an assumed original $1 million starting portfolio in December 2014. Had I used 5.05% the increase would have been to $65,300. That would have been 4% more, but I can’t consider that as a loss of some sort. I’m happier knowing the calculation is more precise.
Conclusion: When I wrote Nest Egg Care, I used the Vanguard Probability of Living Calculator to find the life expectancy that I use as the setting for the years I want for ZERO CHANCE of depleting our portfolio. Those years link to a Safe Spending Rate (SSR%) that I test each November 30 to find our annual Safe Spending Amount (SSA) for the upcoming calendar year. (See Chapters 2 and 9, NEC.) The Vanguard calculator no longer exists. I now use the Social Security Life Expectancy Calculator. It gives about one year longer life expectancy than Vanguard’s gave me six years ago. I show in this post how you can use the SS calculator find your years of life expectancy on your calculation date.