Should Safe Spending Rates (SSR%s) be 25% lower?
Posted on December 24, 2021

I spent a lot time this week trying to understand the details of a new report from Morningstar, The State of Retirement Income – Safe Withdrawal Rate. I summarize the 59 page report. Morningstar predicts much lower stock and bond returns for the foreseeable future. The forecasts are similar to those in this post: 5.7% real return per year for stocks and .4% real return for bonds; these are about 2.4 percentage points lower than historical returns for both. Morningstar translates those lower average returns to find that Safe Withdrawal Rates should be 20% to 25% lower than those calculated using historical returns – the calculations in Nest Egg Care and elsewhere.
== Terms and Definition ==
Morningstar uses the term Safe Withdrawal Rate (SWR). I’ll use that here. (I use the term Safe Spending Rate or SSR%.) I define that the Safe Withdrawal Rate is the withdrawal rate for spending that results in NO CHANCE that a portfolio will deplete to a level that would not support a full withdrawal for a desired number of years. Patti often asks, “Will we run out of money?” I answer, “No, at the rate we spend, we have No Chance of running out of money before 2036. You’ll be 88, and that’s well past my life expectancy.”
(A withdrawal rate is the initial withdrawal amount divided by portfolio value; the amount thereafter adjusts for inflation, maintaining its spending power over time.)
== Finding the SWR ==
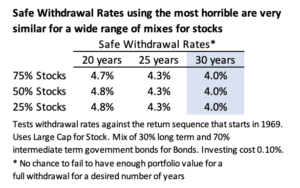
The clearest method that finds a Safe Withdrawal Rate for a given number of years tests a withdrawal rate (and mix of stocks and investing cost) against the actual most-horrible sequence of stock and bond returns in history. A portfolio will deplete the fastest on the most horrible sequence. That sequence will result in the lowest withdrawal rate that provides a full return for a desired number of years: the Safe Withdrawal Rate.
== Much lower future stock and bond returns ==
Morningstar predicts the real rates of return for stocks and bonds will be much lower over the next 30 years than they have been from 1926 to the present, roughly 2.3 percentage points per year lower for both stocks and bonds. This is 30% lower for stocks and 87% lower for bonds – almost to the point of 0% real return for the foreseeable future. OUCH. The predictions are consistent with those of others that I wrote about in this post and this post.

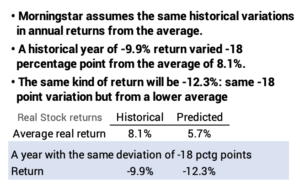
Morningstar assumes the same variability in returns over time. Historically, a year of -9.9% return for stocks varied by -18 percentage points from an 8.1% average return. The same kind of year in the future will have the same -18 percentage variation, but it will be from the lower 5.7% average return. The historical -9.9% return is predicted to be -12.3% return.
== What’s the impact on SWR? ==
Morningstar suggests retirees should use a 22 to 25% lower SWR than they would use if it had been calculated using historical returns. The “4% Rule” should be the “3% Rule”. Morningstar would say the SSR%s in Nest Egg Care are too high; the results you find at FIRECalc are too optimistic.
The simplest way that I can explain the impact is to apply their prediction of lower returns for stocks and for bonds to the actual Most Horrible sequence of returns in history. I’m going to lower the annual return rates in that sequence and find the new Safe Withdrawal Rate.
The Most Horrible sequence is our not so good-looking friend, the sequence of returns starting in 1969. It’s the Most Horrible for a very wide range of mix of stocks and all periods longer than ten years. It ALWAYs depletes a portfolio the fastest and results in the lowest withdrawal rate for a desired number of years: the Safe Withdrawal Rate.
I’ve described this sequence before. It starts with the steepest six-year decline for stocks in history, -44% real return. It has 0% cumulative return for stocks for 14 years, and 0% cumulative return for bonds in 15 years.
== I lower the rates of return ==
My choice for stock and bond returns reproduces the original “4% Rule”. A 4% withdrawal rate will provide 30 years of full withdrawals for a wide range of stock mixes. The SWR is greater for shorter periods. The SWR is also pretty darn constant for a wide range of stock mixes..
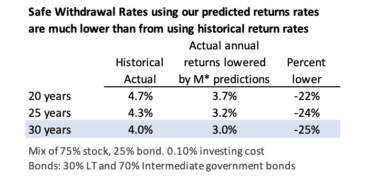
To see the effect of lower average returns, I simply lower each annual return in the 1969 sequence: stocks by -2.4 percentage points and bonds by -2.3 percentage points. (I’ll describe that seqence next week; we may be talking about 30 years of 0% cumulative return for stocks and for bonds!) I then use my spreadsheet to find the new withdrawal rate that gives the desired years of full withdrawals. That’s the new Safe Withdrawal Rate. The SWRs are lower by 22% to 25%, depending on the number of years. I show the result for one mix of stocks, but the declines apply to other mixes.
The corollary is that a retiree needs to have 25% to 33% greater portfolio value to support a desired Safe Spending Amount than he/she may have calculated or found up to now.
== Change the definition of Safe? ==
Morningstar suggests, “It really isn’t all that bad.” It suggests you could choose a spending rate that isn’t Zero Chance of depleting a portfolio. They suggest that you could use a spending rate that is successful 90% of the time. To say it differently, you could accept a withdrawal rate that will fail 10% of the time. Example: there are 76 20-year historical sequences of return 1926-2020. Rather than using the Most Horrible sequence for your withdrawal rate – the one that starts in 1969 – use the withdrawal rate you get using the 7th worst sequence of returns.
Oh, my, I’d have trouble even asking these questions, “You want me to use a spending rate with a 10% chance that I’ll run out of money? And you aren’t telling me the earliest that I could run out of money. How exactly do I tell Patti that at the rate we’re withdrawing from our portfolio, there’s a 10% chance that we’ll run out of money before we die. How do I explain that?”
Conclusion: Morningstar published a report, The State of Retirement Income – Safe Withdrawal Rate. Morningstar predicts stock and bond returns will be almost 2½ percentage points lower than their historical average since 1926. Real stock returns will average 30% lower and bonds will average 87% lower – almost 0% real return for the next 30 years. The implication for retirees is that current Safe Withdrawal Rates using historical returns are too high. I calculate that Morningstar states that current SWRs are 22% to 25% too high. The corollary is that a retiree needs to have 25% to 33% more portfolio value to support a desired Safe Spending Amount.