Part 1: Is your retirement portfolio at its peak value for the rest your life?
Posted on June 25, 2021
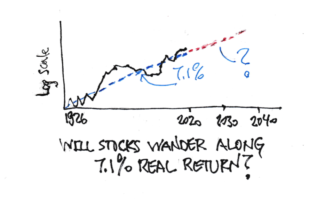
Last week I read this article “The Long-Term Forecast for US Stock Returns = 7.5%”. The article assumes 2.5% future inflation. That means the forecast translates to ~5% real return for stock vs. the historical average of ~7%. That’s 30% lower ((5-7)/7). I can find similar predictions – some from five years ago – that are much lower than the 5% rate. Wow! Those predictions are saying, “Throw away what you think is normal based on history. It’s a very different, worse normal in the future.” I’ve assumed that the future is close to the past, but we need to understand the implications of both of these scenarios. This post discusses what we might expect if the future is like the past: new normal = old normal. That’s clearly a more comfortable future. Next week I’ll discuss those studies that forecast a new normal that is much lower than 7% real return for stocks: that will be uncomfortable!
Here’s the answer to the question: assuming future real returns roughly match the historical real 7.1% return rate for stocks, your portfolio value today is NOT its peak value for the rest of your life. Your retirement portfolio will grow in real spending power over time, because the expected return rate for your total portfolio is greater than the percentage you withdraw each year for your spending.
Example: the expected real return rate for our investment portfolio is 6.4%. Last December Patti and I withdrew 4.85% for our spending (We’re older! That’s zero chance for depletion in 15 years assuming we’re starting now on the Most Horrible return sequence for stocks and bonds in history.).
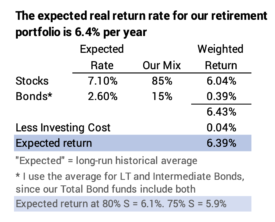
I expect this year to earn back what we withdrew in December and add 1.5% in real spending power. When I calculate for our Safe Spending Amount for next year, I’d expect that Patti and I will have more than enough for our current Safe Spending Amount (SSA; see Chapters 2 and 9, Nest Egg Care.)
Obviously, annual returns and sequences of returns for stocks and bonds vary from their long-run average rate. Returns were such that Patti and I earned back more than we withdrew in four of the last six years. Those years resulted in a real increase in our SSA for the following year. We didn’t earn back enough for a real increase in two years. (See here and here.)
== The past is 7.1% real return for stocks ==
You’ve seen this graph before. The long-run average, real annual return rate for stocks is 7.1%. That’s the average from 1926-2020; the rate would be slightly greater if I added the data from 1871. Clearly 7.1% is not a law of physics, but that’s a lot of history that I’ve viewed that as a pretty darn accurate predictor of the long-term future.
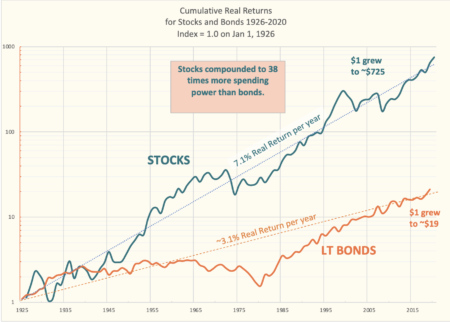
If we think the future will be like the past, we’re making the underlying fundamental assumption that corporate profitability in the future will be similar to the past: profits provide the cash that companies invest back into their business to keep pace with the growth of the economy and to pay out cash to shareholders in the form of dividends or stock buy-backs; buy-backs today are greater than dividends. That seems to be a reasonable assumption.
== Returns should migrate toward the 7.1% trend line ==
Points on the solid line of cumulative returns should migrate toward the 7.1% rate – toward that dashed trend line on the graph. When a point on the solid line is above the trend line, future returns will be lower than 7.1% to reach the dashed line. When a point on the solid line is below the trend line, future returns will be better.
== Where are we now and what does it mean? ==
The data point at the end of 2020 is slightly above the trend line. I calculate that it is 4% above the line.
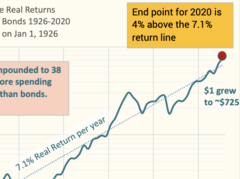
If the solid line hits that 7.1% trend line ten years from now, the cumulative return from the end of 2020 to the end of 2030 will be 4% less than value of 7.1% return compounded for 10 years. That works out to 6.7% real return over that holding period. That’s going to translate to a an expected return for our total portfolio that’s still above our withdrawal rate until we are well into our 80s: our portfolio is not at its peak value.
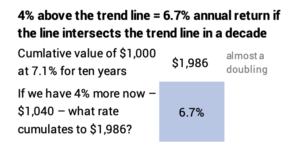
For those in the Save and Invest phase of life, I’d assume the long-term 7.1% real return rate applies for each year’s savings that you hold for long holding periods. Following the Rule of 72, investors in stocks can expect a doubling in spending power about every ten years. I’d still think of it this way: a 40-year-old person who saves this year (2021) will spend that in the 25th year from now (2046). The amount then would be about 6X in today’s spending power, the result of 2½ doublings.

Conclusion: If you believe the future is similar to the past, you believe the long-run future real return rate for stocks is ~7% per year. Stocks dominate your portfolio, and the expected return rate on your total portfolio is less than you are withdrawing each year for your spending. At expected return rates, your portfolio will grow in real spending power and you will calculate to a greater Safe Spending Amount in future years.
The cumulative return for stocks from 1926 to the end of last year is slightly above its long-run trend line. The future return rate to get back to the trend line is slightly less than 7.1%.