How do Fidelity index funds compare to Vanguard’s?
Posted on July 16, 2021
Every January, I complete the Morningstar nine-box display of returns for segments of the market: the box is a matrix of annual returns by company size category (Large, Mid or Small Cap) and investment style (Value, Blend, or Growth). I did not realize that Fidelity has a similar lineup of funds for each box. In this post I compare the nine-box using Fidelity funds with Vanguard funds. I conclude that returns for their index funds in each of the nine boxes are very similar but not identical: they aren’t trying to track the identical benchmark indices. I also add an update on returns for US total stock market funds. Patti and I own one of these, FSKAX.
== The style box and 2020 returns ==
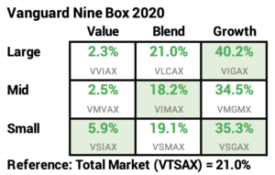
Last January I displayed 2020 US stock returns for the nine-box using Vanguard funds:
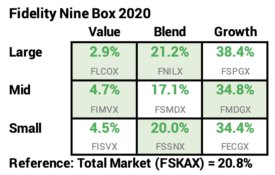
In 2019 Fidelity added four funds that complete their offerings in the nine-box. I did not realize that I could fill the nine-box with returns from Fidelity funds for 2020. I duplicate the nine-box using Fidelity funds:
The returns from the two do not exactly match. The Fidelity fund was greater return in five cases and the Vanguard funds was greater in four cases. The differences are due to two factors:
1) Fidelity and Vanguard aren’t trying to match the same benchmark indices for the boxes. Fidelity tries to match benchmark indices structured by S&P Dow Jones. Vanguard tries to match indices structured by CRSP. (Morningstar shows mutual fund performance compared to benchmark indices structured by Russell.) The three index companies have slightly different definitions of the stocks that comprise a box. They’d differ on the number and specific companies in their large cap growth index, as an example.
2) Fidelity and Vanguard both try to overcome the inefficiency from having to hold some cash for potential redemptions and overcome their expense ratio. The expense ratio for the Fidelity funds are about .025% less than Vanguard’s for each fund. They may use techniques that may employ derivatives, for example. They are better at this task in some years than others. Their tracking error – how close they exactly come to the benchmark they are trying to match – varies year-by-year.
== Two common indices they track ==
I find two rigidly defined – or pretty rigidly defined – indices that they both try to match.
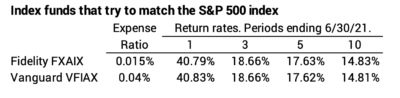
• The S&P 500 index is precisely defined – the composition of companies that comprise the 500, the weight of each, and the timing of new additions and deletions. Returns for their 500 funds are almost identical. Fidelity’s lower 0.025% lower expense ratio has been in place since August 2018.
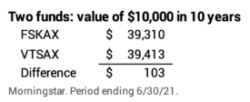
• The S&P Dow Jones and CRSP indices for US Total Stock Market have to be almost identical; they both have to track the same total number of stocks and should calculate identical weights. Vanguard follows more stocks in its fund than Fidelity. Fidelity uses a sampling method for the 150 or so smallest capitalization stocks. Returns for Fidelity and Vanguard are very close.
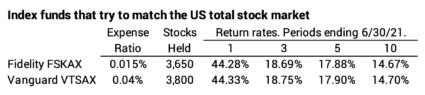
That 0.03% difference in annual percentage return for the past decade translates to a small difference in portfolio value. The difference over a decade is is about $100 per $10,000 invested. That averages to $10 per year; that would translate to $100 per year per $100,000 invested.
This dollar difference is over a period of real returns that were about 75% greater than expected returns: about 12.6% real return vs. 7.1% expected return. I would expect the dollar difference to be much smaller at expected returns.
Patti and I own FSKAX. I think Fidelity’s expense ratio was greater than Vanguard’s for years, and that could explain the difference for FSKAX’s lower 0.03% return rate. I will stick with FSKAX. It’s my only Fidelity fund for all that I have at Fidelity. I think I owe them its small expense ratio – even if that nets me a little less return.
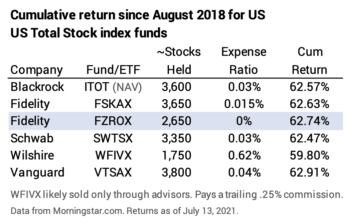
== Six US total stock market funds ==
I displayed performance results for five US total stock funds in my post this April. I did not include Fidelity’s US total stock market fund with 0% expense ratio, FZROX. It’s close to having a three-year history now. I add it to the list and show the cumulative return for six funds for almost three full years. FZROX cumulatively has returned about 0.10% more than FSKAX. The slightly greater return probably reflects its slightly lower expense ratio and good fortune in its sampling of the smallest securities that it does not own.
Conclusion: I did not realize that Fidelity has a line up of index funds that fits into the nine-box of segments of the market, the matrix of funds by focus of capitalization of stocks it holds (large, medium or small cap) and classification of the nature of the stocks a fund holds (value, blend or growth). I compare the Fidelity funds with Vanguard’s. Returns for each box are very similar, but they differ because they aren’t trying to match the exact same benchmark index. I also update a display from early April that now shows the returns for six US total stock market funds.