Did you match our returns for this year?
Posted on January 3, 2020
I’m throwing down the gauntlet. In past years I might have said, “Ha! Beat That!”, but not now. When we’re retired, our challenge is to keep as much as we can of what the market gives. My challenge to you is to compare to see how close you came to returns that Patti and I earned for our stocks and for our bonds this year. If you are close, you squeezed out and kept what you should have. If you are a couple of percentage points off, I’d argue that something’s not right with your portfolio. The purpose of this post is to describe our returns. I hope your returns are VERY CLOSE to ours.

== How I calculate our returns ==
I get the return data for each security we own from Morningstar. Click on the Performance tab for each security. The site updates 12-month, time-weighted returns overnight. I’m compulsive and look to get returns for the year the morning after the last trading day of the year. That was December 31 this year. You don’t have to be as compulsive as I am: Morningstar updated the table of historical annual returns on the Performance page after the first trading day of the year – that was the morning of Jan 3 – to clearly show calendar 2019 returns.
When you only hold four securities like we do and have picked your weights for US vs. International, the calculations to get to totals for stocks and bonds are a snap. Shame on you if you have more clutter – a lot of funds, ETFs and individual securities that you then have to weight correctly to get to your total return for your stocks and your bonds: your task can be painful. Most folks have far more clutter than just four funds/ETFs and just don’t do this calculation. I’ve not seen brokerage statements that help a whole lot with this task. Those folks will conclude that they had a good year in 2019 but they will have no idea how they did relative to what they could have earned from a very simple portfolio.
== Stocks +28%. Bonds 9%. Overall for us +25% ==
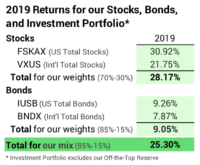
The table below shows the return for each of our securities and my calculation of the total for stocks and bonds for the weights (US vs. International) that I picked and for our portfolio total given the mix (Stocks vs. Bonds) that I picked. (See Chapters 8 and 11, Nest Egg Care (NEC)). Nominal returns for our stocks were up 28.2%. Bonds were up 9.1%. I think my decision on weights results in good benchmarks that you can use for comparison.
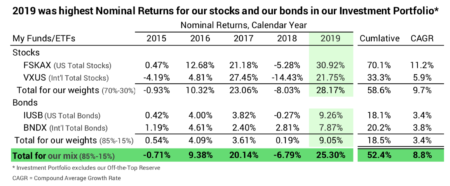
The table below shows that 2019 was clearly our peak year in the last five for our stocks and for our bonds and for our overall total.
== Our real return has averaged 7.4% per year ==
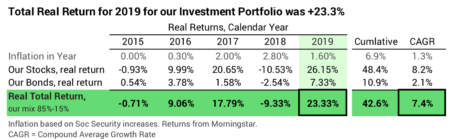
I’m much more interested in real return rates. Inflation just confuses me. Real returns drive real increases in our Safe Spending Amount (SSA). (See Chapters 2 and 6, NEC.) Our real return rate for our portfolio for 2019 was 23.3%. Our average annual return for the last five calendar years is 7.4%. Obviously, the return this year boosted that annual average: at the end of 2018 the four-year average was just 3.7%. The 7.4% is greater than our expected return rate – using the long-term returns for stocks and for bonds – of 6.4%.
== Your return will vary with choice of mix =
I recommend a range of mixes of stocks and bonds in Chapter 8, NEC. Patti and I are at 85%-15%. My friend Steve doesn’t have his eyeballs focused on a distant future year and is more worried about annual ups and downs than I am. He’s more comfortable with 75%-25%. Our 85%-15% mix is about 1.8 percentage points greater real return than Steve’s this year (23.3% – 21.5%).
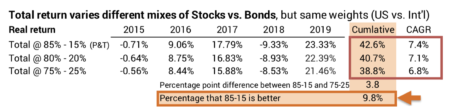
Our cumulative return over five years is about 10% greater than Steve’s. That’s meaningful. That means that Patti and I would now have about 10% greater annual SSA than Steve and his wife, all other things being equal.
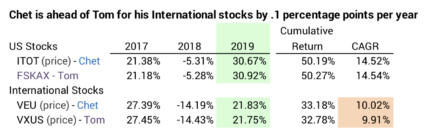
== Your choice of securities may be different ==
You may have chosen different mutual funds/ETFs than I did. My friend Chet and I have the same weights and mix, but Chet picked different securities for US Stocks and International Stocks. We’re the same on bonds. Results for our choices of US stocks are almost identical over the last three years, but Chet’s choice for International Stocks is about .1 percentage point greater average annual return (10.02% – 9.91%).
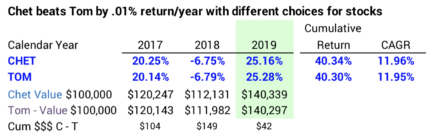
When I add in the return for bonds Chet is running .01 percentage points ahead on the annual return rate for our portfolios (11.96% – 11.95%). If we both started three years ago with $100,000, Chet is now $42 ahead.
Conclusion: Calendar year 2019 was a terrific year for both stock and bond returns. Patti and I earned 28.2% for our stocks and 9.1% for our bonds. Those returns are good benchmarks for you to compare to your returns. You should be VERY CLOSE to those for stocks and for bonds. If not, something is amiss with your portfolio.