What was the inflation change in Personal Consumption Expenditures?
Posted on January 27, 2023
Today we got the second set of measures of inflation for December: the data of Personal Consumption Expenditures – the measure favored by the Federal Reserve. I show two graphs of the trends. One shows the last six months have been at an annual rate of inflation near 2% and the other shows the last six months have been at about 3.5% annual rate. These measures are very close to the changes in Consumer Price Indices that are issued earlier in the month.
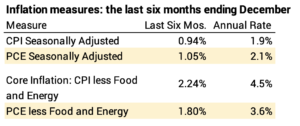
The first graph is total Personal Consumption Expenditures, seasonally adjusted. Inflation for the last six months has been 1%. This is almost identical to the CPI seasonally adjusted that I showed in this post.

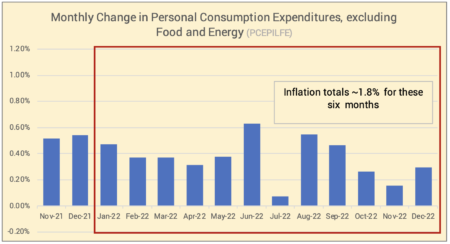
The second graph is total Personal Consumption Expenditures less the volatile food and energy components. Inflation for the last six month has been 1.8%. This is a bit lower than Core Inflation that I showed in the same post.
Conclusion. Early in the month we get measures of inflation for the Consumer Price Index (CPI). Later in the month we get measures of inflation using Personal Consumption Expenditures (PCE). The Federal Reserve favors the latter measures. The data issued today for December show that inflation is running at 2% to 3% annual rate of inflation. This is far better than our peak of 9% inflation (CPI) for the 12-months ending June 2022.