How does the largest actively managed fund – AGTHX – rank against its peers?
Posted on September 6, 2019
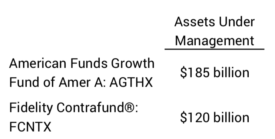
Year ago I remember two actively managed funds battling it out in terms of top rank of size of mutual funds – the amount of money investors have in them: American Funds Growth Fund of America (AGTHX) and Fidelity Contrafund® (FCNTX). Both these funds had their heyday: that’s why they have so much invested in them now. The time period when both funds rocked – performed much better than the market as a whole – was in the 1980s, 1990s and early 2000s. Today a number of index funds outrank these two in terms of assets under management, but they are still the two largest actively managed funds. Morningstar data says that AGTHX is roughly 50% larger in terms of assets under management than FCNTX. $185 billion invested in AGTHX still must be the smart money, right? This post displays how AGTHX ranks against its peer index fund over the past decade. Basic story: not well at all. That great performance from more than ten years ago hasn’t meant anything for the last decade.
== Performance vs. the correct Benchmark ==
Morningstar (M*) does an excellent job of displaying performance of funds, ETFs, and individual stocks over time. M* always has had – well, for as long as I can remember – a graph and data that displays a fund’s performance relative to a performance benchmark. You can see the plot of the fund vs. the benchmark index. Small print at the top of the graph showed what $10,000 invested would have grown to for the fund and the benchmark index. Within the past month or so, M* has changed its display to be more useful to investors.
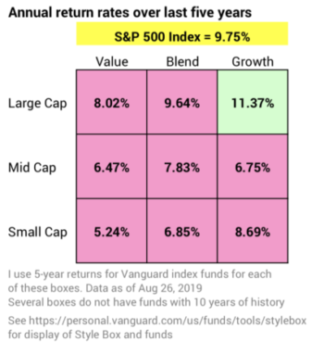
1) M* now displays a funds performance against its peer index fund. A Large Cap Growth Fund like AGTHX is now compared to a Large Cap Growth index. Previously, M* compared AGTHX (and other funds) solely to the benchmark of the S&P 500® index. Over the past five years Large Cap Growth has been the place to be. It’s the only style box that has outperformed S&P 500 index. I think this holds true over the last decade, but I don’t have 10-year data for all the style boxes.
This new comparison – fund to its peer index – is same logic as used in SPIVA reports that compare the performance of Actively Managed Funds to their peer index. Those reports consistently show that roughly 94% of Actively Managed Funds fail to beat their peer index over a decade. Is AGTHX the rare winner of this competition?
2) M* now shows the cumulative dollar growth of a fund relative to the growth of its peer index in BIG, OBVIOUS NUMBERS. Previously you had to look hard a small numbers above the graph to find the comparison.
== How does AGTHX stack up? ==
Hmmm. Not well. I show the comparison two ways:
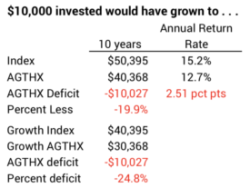
1) Against the peer index. This 10-year data shows AGTHX lags the index by a whopping 2.5 percentage points per year. That cumulates to 20% less than the index; you’d be behind by $10,000 for every $10,000 you had invested in AGTHX a decade ago.
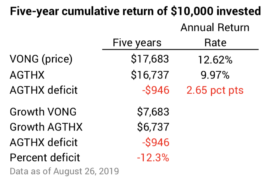
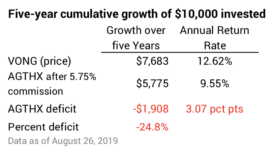
2) Against a fund – actually an ETF – that attempts to mirror the index. This is a better way to look at this, since you could actually own that ETF rather than AGTHX. I only have five years of data for that ETF: VONG. You see AGTHX lagging by more than 2.6 percentage points per year.
Actually it would be worse than this. AGTHX charges a front-end commission of 5.75%. That means your $10,000 was really $9,425 invested into AGTHX and a $575 commission paid to your advisor. On that basis, you were behind VONG by about 3.1 percentage points per year. Ugh: if you decided to invest $10,000 in AGTHX five years ago, you’d be roughly $1,900 behind the alternative of investing in VONG – about 25% behind in growth.
== Few are leaving AGTHX. Why? ==
M* has a display of funds flow for each fund: this shows if investors are pouring money into a fund or withdrawing it. Investors are sticking with AGTHX despite the fact that its performance averages about 2.5 percentage points lower return per year than VONG. Why is this?
1) I think it’s the story of AGTHX and American Funds. You can see this video here. You can get a beautiful brochure from a financial advisor that also tells this story. The story is that American funds will “sometimes lag” when markets are up but the “hand-built” portfolio will decline less when markets decline and “tend to beat the index” for “a history of better outcomes”. (With “tend to beat” and “a history of better outcomes” I’d immediately jump to the conclusion, “That must mean these funds will definitely beat the market over time!”) I see nothing in recent data to say that this is a good bet.

2) It’s the way AGTHX is sold: through financial advisors – the folks that get all or most all of that 5.75% commission and they also get an annual commission of .25% out of the total Expense Ratio of the fund. American Funds has built a sense of exclusiveness with these advisors. (I remember my friend, Alice, telling me, “I have American Funds,” as if that meant she was in really good funds. She now has four index funds for her total portfolio at a fraction of her prior Investing Cost.)
3) It’s a failure to correctly look at the alternative opportunity of selling AGTHX and buying VONG. One has to engage the part of our brain that makes calculations, and that’s hard to do. The intuitive, emotional part of the brain tells folks who own AGTHX two things: 1) hold onto it because we have a taxable gain because we’ve held it for years; we hate paying taxes. 2) Hold onto it because selling AGTHX is throwing away that 5.75% we initially paid; we don’t want to admit that is was a bad decision to have purchased AGTHX in the first place. A cold, hard calculation would say SELL AGTHX and BUY VONG. I’ll explain that calculation in an upcoming post.
Conclusion: Two actively managed funds dominate all others in terms of assets under management, AGTHX and FCNTX. This post looked at AGTHX to see if the smart money was with AGTHX. Over the past five or ten years did it beat its peer index or an index fund that does its best to mirror the index? The answer in both cases is “No”. AGTHX stacks up poorly when compared to both – lagging in annual return by about 2.5 percentage points per year. That difference compounds over time to a large dollar difference.