How do you track to a real increase in your Safe Spending Amount next year?
Posted on December 5, 2025
I’ll use this spreadsheet to track how well our portfolio is doing for our calculation year ending November 30, 2026: will we calculate to an increase in our Safe Spending Amount for 2027? (SSA. Chapter 2, Nest Egg Care [NEC]) If you use this date, you can use this spreadsheet. This spreadsheet is a lot simpler than ones I’ve provided in the past.
Details:
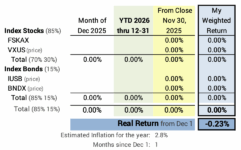
You will enter your age-appropriate Safe Spending Rate (SSR%, Chapter 2, NEC) you used this year and the one you’ll use next year. You’d adjust the cells in the blue column for your weights and mix of US vs. international and stocks vs. bonds.
I update this chart on the first of each month. The return data from Morningstar for the prior month and year-to-date are accurate on that date. I get data from the table on the performance tab for each of our securities.
== We need 0.35% real return!? ==
The calculation for Patti and me shows we will calculate to a real return in our SSA with a 0.35% real portfolio return.

What the heck! Why so little for us?
1. We all just calculated to a real increase in our Safe Spending Amount (SSA, Chapter 2 Nest Egg Care [NEC]). That means all of us assume we are just beginning to ride along on the most harmful sequence of stock and bond returns in history.
2. If our age-appropriate Safe Spending Rate does NOT change for the calculation next year, we’d have to earn back more than the amount we withdrew for our spending this year to calculate to a real increase next year. If we earn back all that we withdrew, we obviously didn’t start on a most harmful sequence of returns. Our real return rate has to be slightly greater than the percentage we withdrew.
Patti and I don’t have to earn back all that we withdrew, because our age-appropriate Safe Spending Rate use for our calculation next November 30 increases. We need less portfolio value for the same SSA when we calculate with the the greater SSR%. We withdrew 5.50% and ur SSR% increases by 5.50% [(5.80%-5.50%)/5.50%)]. The math works out that we need a bit more than 0% real return to calculate to a real increase next year.
SSR%s increase over time for the same reason our RMD percentages increase over time: our retirement period – life expectancy – is shrinking.
Conclusion. This post gives you a spreadsheet you can use to track to see if you will earn a real increase in your Safe Spending Amount that you’ll calculate a year from now. Patti and I need a small real return in our portfolio – less than 1% – because I’ll use a 5.5% greater SSR% for the calculation next year.