Tom’s Blog


Stocks Real = 7.1%. Bonds Real = 2.3%
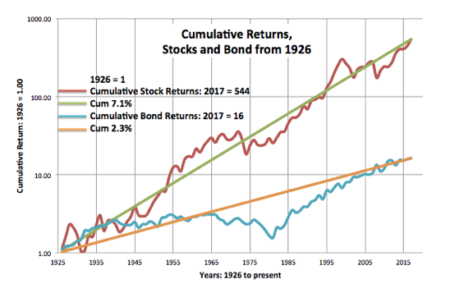
I’ve shown this graph in prior posts (download full view here), but the purpose of this post is to look at this graph in more detail and to better understand the implications for our financial retirement plan.
This is the plot of cumulative
Think Real. Not Nominal. You’ll understand more clearly.

I always like to think of future financial returns in terms of inflation-adjusted dollars, generally called constant dollars. These are dollars stated in the same purchasing or spending power of some base year. Current dollars are the nominal count of the pieces of paper