Do Active funds underperform by their added costs?
Posted on April 7, 2023
The simple math states that both Index funds and Actively managed mutual funds should underperform the market by their costs. It’s pretty clear that this math works for Index funds, but does the historical data support this conclusion for Actively managed funds? Yes, it does. Actively managed mutual funds in aggregate underperformed the market over the last 20 years by 1 percentage point per year. This closely matches their weighted-average expense ratio of .9% per year over the last 20 years.
The 0.1 percentage point difference implies active funds managers were worse stock pickers than a passive index fund, but I don’t think it is fair to conclude that. On the other hand, one can conclude that they are not better stock pickers than a passive index fund.
I summarize key data from two sources in this post: the most recent SPIVA® report from S&P Global that compares the performance of Actively managed funds relatively to their benchmark index and data latest Fact Book from the Investment Company Institute that displays the expense ratio of Actively managed funds over time. This post builds on the post of three weeks ago.
== Four major conclusions ==
Data from the two reports supports four major conclusions.
1) Over all periods of three years or more, fewer than half of retail Active mutual funds fail to outperform their benchmark index. The percent that outperform declines with more years.
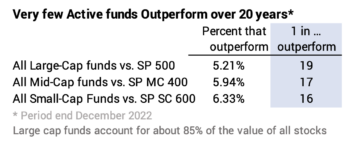
2) Over the past 20 years no more than 1 in 16 Active funds outperformed their benchmark index.
3) Over the past 20 years Active funds returned about 1 percent lower annual return than market the to their investors; that 1 percent basically matches their expense ratio. We can conclude that managers of Active funds in aggregate are not better stock pickers than an index fund.
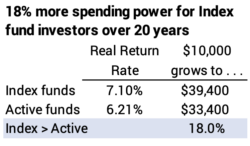
4) For an investment 20 years ago, Index fund investors would have 18% more money than the average of Active fund investors.
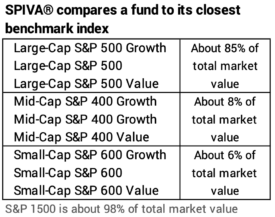
== SPIVA® December 2022 ==
SPIVA® compares the performance of retail Active mutual funds – the kinds of funds that you and I can buy – relative to an S&P index that most closely matches the style of the fund.
Retail Active funds is one category of active investors. Institutional investors such as state and public school employee pension funds and university foundations are another category of active investors; financial institutions such as insurance companies are another category. If these investors are active – trying to pick winners and avoid losers – they typically hire their own advisors to construct their stock portfolio; they generally don’t invest in retail Active mutual funds. SPIVA® does not gather data on the performance of these two and other categories of active investors.
== VERY few outperform ==
To outperform their benchmark index, an Active fund has to outperform other active investors by enough to more than overcome their higher costs. SPIVA® finds fewer than 1 in 16 retail Active funds overcome their greater costs and outperform their benchmark index over 20 years.
These odds would be essentially the same if we were comparing to Index funds and not an Index. That’s because the expense ratio for Index funds is very low. You can find an S&P 500 Index fund or a total US market fund that tracks an S&P index at 0.015% expense ratio. You can find Index funds that mirror the SP Mid-Cap 400 and SP Small-Cap 600 at 0.08% expense ratio.
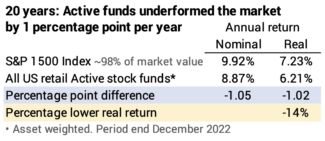
== Active: one percentage point lower return ==
Over the last 20 years Active funds underperformed by one percentage point in return.
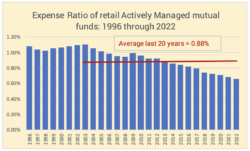
== Expense ratio ~1% per year ==
The expense ratio of retail Active funds averaged 0.88% per year for these 20 years.
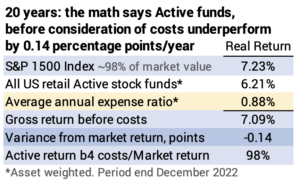
The .88% average expense ratio does not precisely agree with underperformance of 1.02 percentage points. If one adds back the 0.88% expense ratio to the net return, the result is that Active fund managers under performed the market, before consideration of costs, by 0.14 percentage points. This implies their stock picking was worse than that of an Index fund. But but I don’t think it’s fair to conclude that.
The 0.14 percentage point difference is within the error of our ability to accurately collect and analyze the data: the comparison of the aggregate of active funds to a broad market index will never be a perfect apples-to-apples comparison. Many index funds focus on a segment of the market. The aggregate of all Index funds almost certainly did not match the exact ownership percent of each stock of the S&P 1500 index. Therefore, the aggregate of all Active funds almost certainly did not match the exact ownership of each stock in the index. We really can’t conclude that the 9.92% benchmark is a perfect benchmark.
I think it is fair to conclude, however, that retail Active funds managers in aggregate are not better stock pickers than an Index fund.
== 18% more from Index funds ==
Over the past 20 years, the weighted-average expense ratio for an Index fund was 0.13%. If I use the net rate of return to investors, an Investor in a broad market index funds 20 years ago would have 18% more in spending power than the average investor in Active funds.
Conclusion: This post summarizes S&P Global’s SPIVA® report for the 20 years ending December 2022 and the ICI Fact Book for 2022. The SPIVA® report shows that fewer than half Actively managed funds outperform their benchmark index in three years. The number of funds that outperform in 20 years is no greater than 1 in 16. Actively managed funds in aggregate have underperformed the market benchmark index by about one percentage point per year – and this basically matches the weighted-average expense ratio for Active funds over the past 20 years. I argue the data confirms the simple math that retail Active funds will underperform Index funds by the difference in costs.