Your worry point is far down the shaft of your hockey stick.
Posted on November 24, 2017
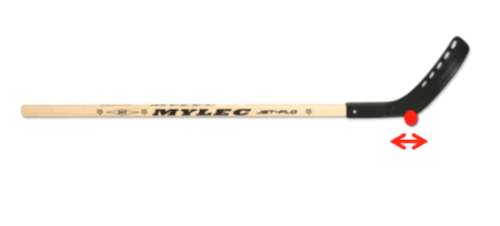
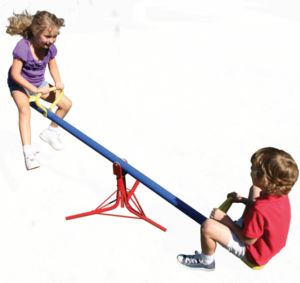
Most of us worry about bad variability in stock returns. Our focus, our worry point, is usually no further than 12 months away. The image in our head is a seesaw or roller coaster. When we’re retired – with the right plan – our real worry point is many years away, typically decades for most of us: that point is the first possible time we might deplete our portfolio. You totally control that point and the probability of depleting your portfolio in the years thereafter by decisions you make for your retirement financial plan. The correct image in our head should be a hockey stick.
Financial risk is defined in terms of variability of returns. We’ve had it drummed into our heads that risk is measured by one-year variability of returns. The statistical measure of the ups and downs of one-year returns (Standard Deviation) calculates that stocks are three times more variable in return than bonds. We can view stocks as a wildly swinging seesaw. Bonds less so. We therefore correctly conclude that stocks are riskier than bonds.
This model of annual variability in returns as the measure of risk, fear, and worry is reinforced time and time again. Financial professionals are excellent in probing to make customers “Feel the Pain.” The pain they want you to feel is FEAR. It’s the same fear our ancient ancestors on the savannah felt when they heard unusual rustling in the bushes behind them. “Is that a predator that might kill me?” Financial folks like clients who think variability of returns is the predator that might kill them. Some argue that some financial professionals exploit fear to sell investment products you don’t need.
This image of risk, fear, and worry is incorrect for our retirement financial plan. The right approach to a plan removes the variability of market returns. What? Yes! A seesaw or roller coaster is the wrong image of risk. The correct image is a hockey stick.
We must use a Retirement Withdrawal Calculator (RWC) to get the right view of risk, fear, and worry. The right kind of RWC tells us the ABSOLUTELY MOST HORRIBLE sequence of annual returns we might face in the future. Once we know that sequence (and the few others like it), we then set our spending rate such that we know that we WON’T DEPLETE OUR PORTFOLIO for any number of years we pick. That rate is our Safe Spending Rate (SSR%). (We must follow certain investing rules that RWCs implicitly tell us to follow; the most fundamental rule is for us to keep as much of what the market gives us in returns as possible.)
This approach – ALWAYS SPEND AT A RATE THAT ASSUMES THE WORST FUTURE POSSIBLE FUTURE – has taken out all concerns about the variations of annual returns. We’ve assumed no variations of cumulative returns. Only the absolute worst. The basics of our plan is built on NO OPTIMISM about the future.
(We can see from the data an RWC presents, however, that it’s 99% probable that the sequence of returns we really will experience will be better than worst case. And the average sequence we might experiece is much better. In that sense, we should be very optimistic. Part 3 of Nest Egg Care shows we can figure out if we’re no longer on a WORST CASE track and if we can step up our spending. But even when we step up, our spending rate will always be based on the worst possible future from there on out.)
We can plot the probability of depleting our portfolio from the data an RWC gives us. Typically all of us will pick a spending rate that gives us decades of zero probability of depleting. That plot on a graph is a long line at zero. Then there’s an inflection point and a rising probability of depleting thereafter.
I like to think of each of the plots for a spending rate as a hockey stick: a long shaft, an inflection point, and a blade angle thereafter. And I like to describe the stick in terms of spending per $1 million initial portfolio value. A 3.5% spending rate is a $35,000 hockey stick, for example.
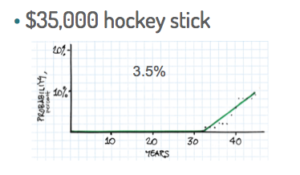
You can also see on this graph that a 3.5% spending rate results in about 32 years shaft length (years of zero probability of depleting). That 3.5% spending rate is not much different than one would calculate if one assumed zero percent real growth over that period. And that’s generally true for all return sequences that RWCs build: the worst sequence of returns for any period of time has long stretches of zero percent cumulative return; shorter sequences of return are worse and cumulate to less than zero percent return.
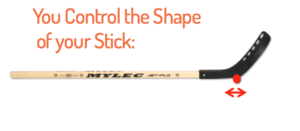
Your decisions COMPLETELY control the shape of your hockey stick – the year-by-year probability of depleting your portfolio. Remember: there is no Market Return Risk in your stick, since it’s assumed the WORST EVER sequences of returns. You’re in complete control of the shaft length of your hockey stick – the point where the blade angle rises. Your first decision is to pick a desired shaft length (years of zero probability of depleting) and you then know your spending rate. Two other decisions you make can shorten or lengthen that stick. Many retirees ignore investing cost – the net cost all of us incur relative to market returns when we buy and hold securities. But that’s an important design decision: high cost shortens your hockey stick significantly. A stick that you think is safe is rendered unsafe with high investing cost. And your choice of mix of stocks and bonds also affects shaft length, but (surprisingly) to a much smaller degree than investing cost.
Once you understand your stick, it may take time to grow to trust it. I attended an evening presentation last week, and the speaker said it takes six months to change a behavior – it takes that length time to rewire the thought patterns in your brain. It’s not easy to shift your thinking from the image of the seesaw or roller coaster of daily, monthly and annual variability of returns to a hockey stick. But we all need to do that.
You can see here that I really like our stick! It’s the one Patti and I will use for our 2018 spending – a $47,500 stick (a 4.75% SSR%). I tell myself as look at that stick: “You should not be very concerned about one year or even two years of bad variability of returns. Your real worry point is nearly two decades away. Put worry into the distant future. Enjoy More. NOW.”