What’s my market outlook for stocks for 2018 and beyond?
Posted on January 26, 2018
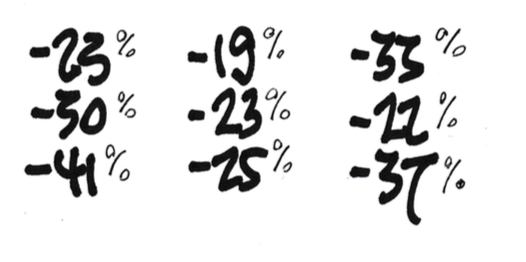
What the heck are those? Those are the nine worst annual (calendar year) real (inflation-adjusted) returns for stocks since 1926 – over the past 92 years. HORRIBLE! UGLY! SCARY! The message of this post: Nest Eggers ALWAYS plan for the worst and adjust if it turns out not to be the worst.
None of those returns would be my answer for the Outlook for 2018 or the next few years. The true outlook for stocks, as I read all the pundits, is NOT for a disaster year like one of those. Economic growth is forecast to be positive in 2018; retail sales are on a steady upward trend; unemployment is low and forecasted to be lower; consumer confidence is high; real wages for workers have increased; inflation is low and its not forecasted to increase by much; tax rates for corporations will be lower in 2018. “The U.S. economy is in solid shape at the end of 2017 and should continue to improve well into 2018.” (Read here.) Heck, stock returns are up +6% so far.
Am I going to base how much we spend or how we invest on what those pundits say or on the good bump so far this year? HELL NO. I’m the ULTIMATE PESSIMIST when it comes to our financial retirement plan: I have the pedal pressed to the metal in my pessimistic-mobile at the start of every year. And right now, too.

We Nest Eggers live by this mantra: ALWAYS PLAN FOR THE WORST and adjust if it turns out not to be the worst. That’s the Nest Egger way!
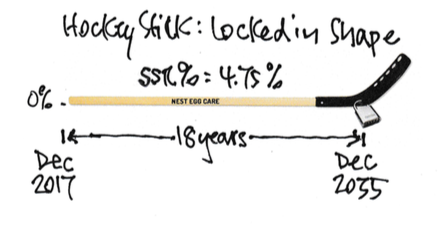
Just to review, ALWAYS PLAN FOR THE WORST drives our Safe Spending Rate (and therefore our Safe Spending Amount) to a low level. Here’s the picture of our plan at the start of 2018 that I described in a previous post. It looks like a hockey stick with the inflection point LOCKED into place: 4.75% Safe Spending Rate (SSR%); 18 years of zero probability of depleting our portfolio through 2035 (the shaft of the stick). That’s to Patti’s age 88 and my age 91, beyond the life expectancy of each. (Obviously we’ve made the key decisions on How To Invest to know that we’ve LOCKED IN the shape of our stick.)
You’re an ULTIMATE PESSIMIST, too, when you pick the Safe Spending Rate (SSR%) linked to the number of years you pick. Every stick assumes we will hit one of those HORRIBLE, UGLY, SCARY returns starting on January 1, 2018 – and maybe another one in 2019. (That combination for two of those ugly nine years has happened! Three times!) We know our plan can absorb HORRIBLE blows like those and NOT DEPLETE our portfolio for the number of years we picked. (I’ll post more on how bad bad stock returns can be in an upcoming post.)
Let’s admit it, though, Patti and I would certainly be SHAKEN if we’re hit in 2018 with a return like one of those worst nine. I discuss how we cope with disturbing, frightening bad variability of stock returns, in Chapter 7 in Nest Egg Care, but I’ll also add posts on this topic.
Conclusion. Nest Eggers always plan assume we are riding on one of the most HORRIBLE sequences of future financial returns in history. These HORRIBLE sequences are really UGLY and SCARY. And, fortunately, fairly rare. That planning assumption drives our Safe Spending Rate (SSR%) to a low, safe level. For 2018, Patti and I picked 18 years for zero probability of depleting our portfolio: that’s our 4.75% spending rate for 2018.
Data source: Return data is from Ibbotson, Stocks, Bonds, Bills, and Inflation (SBBI) Yearbook. I calculated Total Stock Market returns as 80% S&P 500 and 20% Small Cap Stock. (Ibbotson has its Small Cap Stocks as the lowest 20% quintile in market capitalization.)