What mid-year corrections should we make to our financial retirement plan?
Posted on June 7, 2019

Like most all of us, I look often to see how the market and my holdings are doing. (Patti has it right: she never looks!) My looks are quick: is the market up or down today? Are my holdings up or down today? I know US stocks are generally up 10% or so in 2019, but I don’t calculate how we are doing overall very often. This week I calculated our six-month return ending May 31. May 31 is our six-month mark, because I use the 12-month results ending November 30 to calculate our annual Safe Spending Amount (SSA) for the upcoming calendar year. This post shows my calculations, states what I think our return implies for the end of the year calculation, and describes my view of needed actions now. That’s easy to summarize: NONE!
== Six-month Results: 1.8% ==
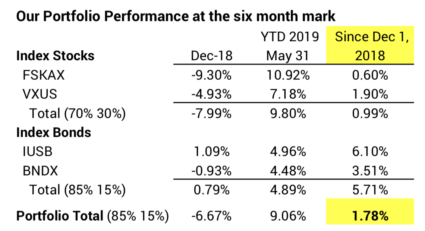
Our Investment Portfolio is up 1.8% at the six-month mark. As I describe here, I get the percentage return for each security I own using returns published by Morningstar: I only have four securities to worry about, so the calculation of the return on our total portfolio is very simple.

Results for YTD 2019 year are good, but I almost forget that stocks nose-dived in December. Bonds did not. As described in this post, that’s what bonds are supposed to do: when stocks crater, they don’t. We see a one-month snapshot of the insurance value of bonds at work. I won’t withdraw for spending for 2020 until early December this year, so this one-month view of bonds doing their job doesn’t mean anything. When I reach the 12-month mark on November 30 and sell securities for our spending in 2020, I may or may not see that same insurance effect at work over the whole year.
== What does that 1.8% imply? ==
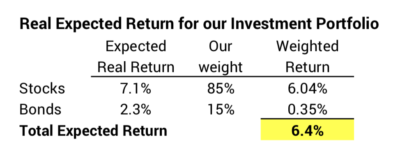
Inflation is running about 2% per year – 1% over the last six months – so my real return over the last six months is about .8%. That’s a rate that is lower than my expected real annual return of 6.4% for our portfolio. Roughly 1% real return is not great, but it’s not horrible.

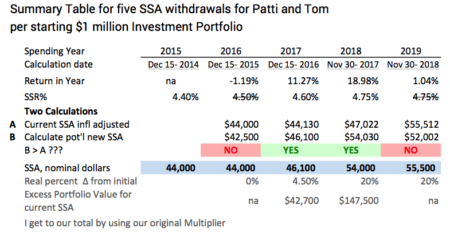
The roughly 1% real return tells me that Patti and I on track for the same Safe Spending Amount (SSA) in 2020 as in 2019. We are not on track to calculate a real increase in safe spending. I’d simply adjust our current $55,500 SSA for inflation. That’s okay because that’s a 20% real increase in spending power from the start of our plan – $44,000 spending in 2015. Here’s the summary of our calculation of annual SSAs so far. You’ll find the full explanation of the calculation in Chapter 9, Nest Egg Care, and the discussion of last December’s calculation here.

We may also be on the track for no real increase in spending for 2021. Nesteggers recalculate to a greater, real SSA when – basically – the real return on our Investment Portfolio exceeds our withdrawal rate. for example, we took out 4.6% for spending in 2017 and earned 17% real return in the year: that told me we’d have a big, real increase in our Safe Spending Amount for 2018.
Patti and I earned about -1% real return in the 12-months ending last November 30, 2018. We may be better but not my much this year. Let’s assume we earn less than 4% total real return for the two years. Our withdrawals will total about 9.5% for the two calendar years 2019 and 2020. That means we will have some catch up to do from greater returns for 2020 if we are to calculate a real increase for 2021.
== What adjustments should I make? ==
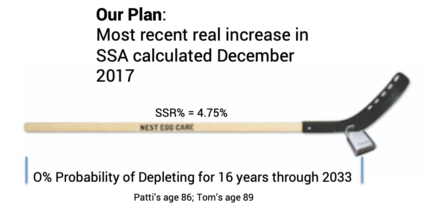
None. I have no reason to change our plan: spending rate, investing cost (already rock bottom; I really can’t get much lower), or mix of stocks vs. bonds. Our last real increase, calculated at the end of 2017, set us on a path of zero chance of depleting our portfolio through 2033.

The plot of the chance of depleting our portfolio looks like a hockey stick: many years of zero chance of depleting, an inflection point, and an increasing chance of depleting in the years thereafter. We locked that inflection point with our three key plan decisions. That shaft length through 2033 is to Patti’s age 86 and my 89; I can calculate that it’s 15% probable that we’ll both be alive then.
Conclusion: Every now and then we need to take a snapshot of how our portfolio is performing in the year. Unless you use December 31 as the ending date of your calculation year, the return that you want to track is a combination of one or two months of the prior year and the return year-to-date.
The six-month return for Patti and me, ending May 31, is 1.8%. That’s not horrible, but it is tracking to a return that leads me to think I won’t be able recalculate to a greater real Safe Spending Amount (SSA) for 2020. It looks like our SSA will be the same amount in 2019; we will simply adjust the current value for inflation. Our spending amount will still be 20% greater in real spending power than in the first year of our plan.