What does PSERS do to improve its investment returns?
Posted on June 4, 2021

I went CRAZY this week thinking about PSERS – Pennsylvania’s School Employees Retirement System. I wrote about PSERS two weeks ago, but I couldn’t get it out of my head this week. Why? PSERS is committed to an investment strategy that we nesteggers would not AT ALL attempt. PSERS attempts to beat a simple benchmark of index funds for their $60 billion (!) portfolio. I dug into the details of PSERS relative performance this week and found it to be much worse than I thought. The purpose of this post is to show what happens if you don’t set a clear benchmark for performance and measure your performance against it. The post shows another example of the folly of trying to outperform what the market gives to all investors over time.
== Set a benchmark ==
We nesteggers understand the concept of benchmark. The simplest benchmark for a portfolio has to be the average that the market gives to all investors for stocks and bonds. Heck, the purest nesteggers hit that benchmark year after year because we only invest in stock and bond index funds that gives us what the market delivers – less a tiny investing cost.
I illustrate the benchmark for stocks and bonds in the graph; you’ve seen a this graph before. The real expected return – the average, long-run nominal returns adjusted for inflation – is 7.1% per year for stocks. For this post I average the real return rates for long-term and intermediate-term bonds and get 2.6% real return rate.
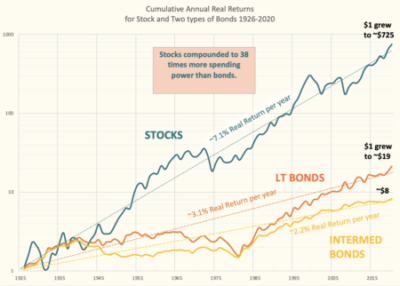
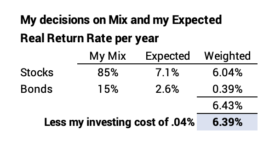
Your benchmark for your portfolio is determined by your decisions on your mix of stocks vs. bonds. (See my logic and decisions in Chapter 8, Nest Egg Care [NEC]). Using the 7.1% and the 2.6% and my decisions on investing cost, the expected return for my portfolio mix is 6.4% real return per year.
We nesteggers understand that actual returns we’ll get over time wiggle around those straight trend lines on the graph. The actual historical return rate for stocks, for example, for a number of years is the slope of a straight line drawn between the two years on wiggly line. The straight line you draw between two points rarely parallels the 7.1% line; steeper slope is greater than 7.1% and shallower slope is less than 7.1%. I wrote about my 8.7% real return rate on the steeper slope from 1985 to 2021 here.
== PSERS trailed by 2.6 percentage points/year ==
All investors should annually compare their performance to a benchmark. This post has the benchmark I suggest you use for calendar 2020 for your portfolio. If you are invested in similar index funds as mine, of course you nearly match this benchmark.
To compare with the returns for PSERS, I constructed the returns for index funds that match my benchmark portfolio for 12-month periods ending each June 30; that’s the fiscal year end for PSERS. (I use Morningstar to find returns for any security for any period in the past.) My detailed spreadsheet compares PSERS’ annual returns to the returns for the benchmark. PSERS trailed the benchmark return in seven of last 10 years and trailed by an average of 2.6 percentage points per year. UGH.
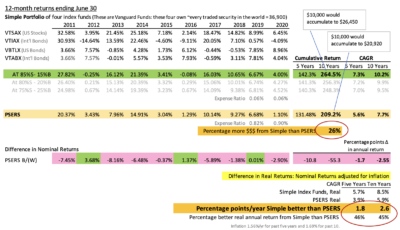
That deficit adds to a 26% deficit in cumulative returns for the portfolio at the start of the 10 years. When you are working with a portfolio the size of PSERS’, that translates to perhaps a $15 billion shortfall over a decade! (That’s the calculation using time-weighted returns. With the additions from current employees and employers and withdrawals for retiree benefits, the money-weighted return and dollar impact will be different.)
== Benchmark return worth $20? billion ==
PSERS is a defined benefit retirement plan and has a large unfunded pension liability. (It’s another story as to how that happened.) Accountants forecast the future stream of payments PSERS will make over the lives of all their participants and then discount them to the present value using, in PSERS case, a real return rate of 4.5%. That rate calculates the total needed was $107 billion as of last June 30; PSERS had $58 billion and therefore was $49 billion short. That $107 billion is sensitive to the assumed discount rate used. The accountant’s report shows that one percentage point more – 5.5% real return – would slash $10 billion from the unfunded portion, and the 6.4% benchmark is another .9 percentage point. The benchmark is slashed by ~$20 billion if PSERS just matches its benchmark.
== Evidence: Can PSERS outperform? ==
PSERS is committed to an investment strategy geared to beating the returns it would obtain from a simple portfolio of stocks and bonds. We nesteggers don’t try to do this, but let’s ask again, “Will this strategy work?” I think the one can only conclude, “NO”. Here are the problems:
• There is no long-term data to set the expected return from certain of PSERS asset classes and therefore there is no overall expected return rate for the portfolio. This report lists its assets classes, and several of those would throw me for a loop if I was trying to figure out the expected return: its asset classes: “risk parity” is 8% of assets; absolute return” is about 10% of its assets; commodities 8%; infrastructure 3% that is separate from real estate, “master limited partners” is 2%. If you can’t set a benchmark for the expected return rate for an asset class, you can’t possibly construct your overall expected return rate, and you can never judge how well your choices within each asset class are performing.
• The evidence from ten years of PSERS’ performance shouts, NO. Underperformance is consistent. There is no pattern – no hint, I’d say – to suggest the portfolio will outperform. If this were your portfolio, you’d stop and change direction. If you were on the investment committee for any investment fund, you’d stop and change direction.
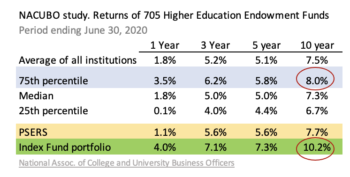
• The evidence from the results of 705 college and university endowment funds loudly shouts, NO. These endowments have a lot of smart people trying to beat the performance of index funds. The recent report by NACUBO shows that the better of them – those at the 75th percentile of performance – lag the benchmark of index funds by 2.2 percentage points per year. That is just UGLY in my opinion.
It’s some sort of group-think for PSERS and all those endowments that results in their sticking with broken investment strategies.
PSERS has to get off its broken investment strategy. The start is that any new investments have to be invested in a portfolio that matches the benchmark. It may take years to unwind much of its illiquid investments, but that’s the only way to bring its fund back to health.
Conclusion. I was obsessed thinking about PSERS this week even though I wrote about it two weeks ago. A detailed comparison of PSERS’ performance shows it lags a simple-to-match benchmark of performance by 2.6 percentage points per year. That deficit is costly: a shortfall in what it could be now of perhaps $15 billion and what it could be in the future of another $20 billion. $35 billion. I see NO EVIDENCE to suggest that PSERS or 700 university or college endowment funds should be trying to beat simple benchmark that we nesteggers hit every year.