What’s the benchmark you use to judge your portfolio return for 2020?
Posted on January 1, 2021

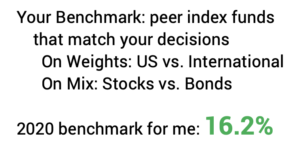
It’s the time of year that most of us judge how well our portfolios performed for the past year. To judge your portfolio correctly, you want to compare your results to a benchmark comprised of an appropriate mix of peer index funds. The purpose of this post is to suggest that the basic structure – and performance – of my portfolio is a good benchmark for you to compare to your results for calendar 2020. Your retirement portfolio did well if you are close to 16.2% return. In my opinion, something is amiss if you are more than one percentage point less than this.
Obviously if you only invest in index funds, like I do, you’ll be right on your benchmark. Unfortunately, far too few folks do that. They have portfolios that are complex and costly. The task to compare to a proper benchmark is very, very difficult for those folks. They give up trying to understand relative performance. They’re stuck. They have no good idea of the value or of their complexity and cost. The financial industry LOVES those folks.
== Compare RELATIVE performance ==
I’m surprised that many people I know have DON’T REALLY KNOW how well their portfolio performs over time. A friend of mine, Fred, told me he was very happy to pay his financial advisor and firm .75% fee, because his advisor and firm are pros. That’s .75% on top of fund fees – the expense ratios of the funds he owns – that are not clear in Fred’s mind. My guess would be that Fred pays more than 1.25% in fees relative to the .05% that Patti and I pay. Those pros better be good!
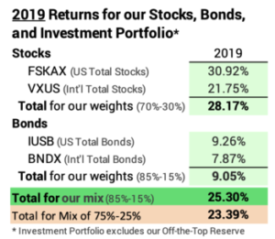
Fred said he was very happy with 20% return in 2019. On an absolute scale, 2019 was a very good year – returns were well above average. He can be happy with that, but that return is NOT GOOD on a relative scale. Patti and I earned +25% in 2019 from just four index funds. Fred earned five percentage points less: that’s way more than one might expect from the inherent cost difference. Part of that difference may be from a lower mix of stocks, but I’d guess stock picking by the pros was poor. I asked, “Fred, does your advisor structure a benchmark for your mix of stocks and bonds so you can compare relative performance?” “No.”

== How did Patti and I do in calendar 2020? ==
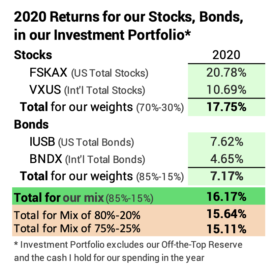
This morning Morningstar posted the 2020 returns for the four securities that Patti and I own. We earned 16.2% for the year. I suggest that’s a good benchmark to use for your portfolio. If you invest in the market as a whole without big tilts – a tilt to small cap; a tilt to growth; a tilt to value, as examples – you should be close to our results. If you are more than a bit more than one percentage point less than this – less than 15.1% – I suggest you have work to figure out how to get closer to your appropriate benchmark.


You can construct a more precise benchmark for your choice of weights of US vs. International and mix of stocks vs. bonds. The design mix of our portfolio is 85% stocks = 16.2% return in 2020. The benchmark for 80% stocks = 15.6%. The benchmark for 75% stocks = 15.1%. I describe in Chapter 8, Nest Egg Care that a mix of less than 75% stocks makes little sense to me. Therefore, 15.1% is the rock bottom benchmark for your portfolio.
== Figuring your return ==
Figuring your return on your total portfolio return isn’t easy if you own a lot of securities. You want to track your time-weighted return that removes the confusion of the changes in total dollar amount from adding or subtracting money during the year.
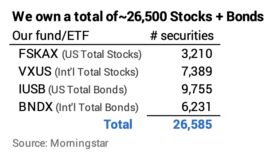
I’d guess that most folks own A LOT more securities than the four that Patti and I own, but wind up owning a lot fewer than the 26,500 stocks and bonds that our four own.

These folks have a DEVIL of a time even understanding the structure of their own portfolio – weights and mix – and then assembling an appropriate benchmark of peer index funds to use to compare their results. It could be a MONSTER spreadsheet. It’s so much work that they just don’t spend the time to properly calculate their total return. If they have an advisor, I bet he or she isn’t going to calculate it. They’re locked in to roughly understanding their absolute results – not their relative results to an appropriate benchmark. That’s just not acceptable for a financial retirement plan – really a plan at anytime in life – in my view. WAY TOO SLOPPY.
== The last six years for us ==

The real return for our portfolio has been 8.5% real return per year relative to 6.5% expected return on our portfolio. That’s two percentage points more per year and about 30% greater. That growth has fueled the 32% real increase in our annual Safe Spending Amount that I describe here.
Real returns for our stocks have averaged 9.5% per year relative to their expected, long run average of 7.1% per year. That’s 2.4 percentage points more.
Real bond returns have averaged 2.7% per year relative to their expected, long run average of 3.1% per year. That’s .4 percentage points less.
Conclusion: 2020 was another really good year for stock and bond returns. On an absolute scale, we all have to be happy. Patti and I earned 16.2% on our Investment Portfolio. I think that 16.2% is a very good benchmark that you can use to judge your relative results. You should be no lower than a bit more than one percentage point less than that – no less than 15.1% in total. If your portfolio return is less than this, something is amiss. You should be figuring out how to get closer to an appropriate benchmark of performance for your portfolio.