My 4.5% Pay Raise Calculation, December 2016
Posted on September 29, 2017

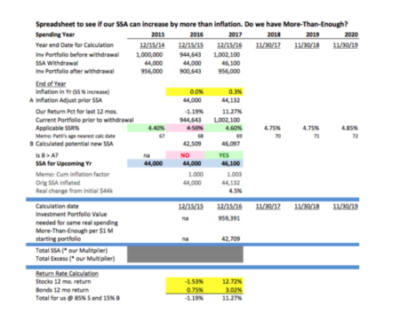
You can see the calculations on this spreadsheet. I first entered the return rates for the prior 12 months for our stocks and for our bonds. (You can see at the top of the sheet that I used December 15 as the end of year for this calculation. That’s turned out to be an awkward choice; getting accurate return rates for that ending date is harder than it should be. I’m shifting to November 30 for the calculation at the end of 2017; I’ll have a 50-week year.)
I also entered the inflation rate for the year. Those are the only three numbers (highlighted in yellow on the sheet) that I have to enter each year on this spreadsheet .
The spreadsheet does the rest once I move the calculations one cell to the right.
Our SSA for spending in 2017 increased by 4.5% real rate to $46,100 (times our multiplier), and this was also a 4.5% real increase from our start of spending in 2015. The spreadsheet also shows that if we continued to spend C$44,000 in 2017 we had $42,700 “more than enough” for that spending (times our multiplier).
Our plan is to always “pay ourselves” our calculated SSA. And that’s what I did, altering our monthly auto transfer from our investment account to our checking account (our “paycheck”). What we don’t spend out of the $46,100 (times our multiplier), we’ll gift before the end of 2017.