How many Fidelity actively managed funds have outperformed their peer index fund?
Posted on May 11, 2018

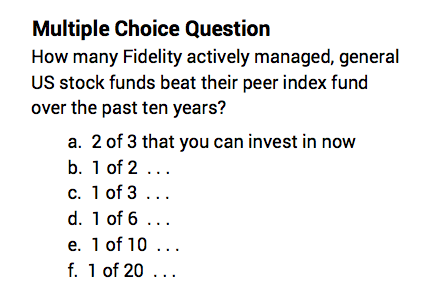
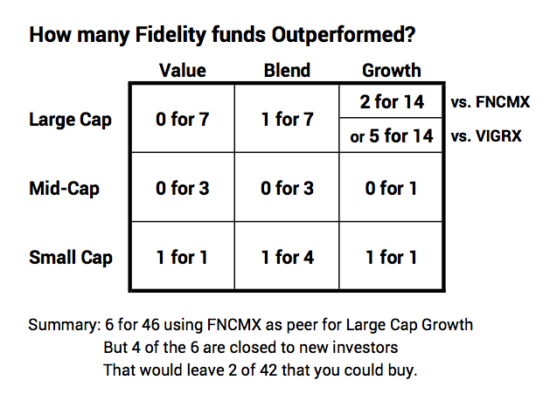
I count 46 actively managed, general stock funds at Fidelity, and I conclude that you can buy two that have outperformed their peer index fund over the last decade. Four of the 46 are closed to new investors (four of the best performing funds). So just two of 42 available to new investors outperformed. (That’s answer f.) That sorta means that when you pick and buy an actively managed fund from this batch, it’s about 95% probable – based on this history – that you will perform worse or no better than a peer index fund. Ugh.
The purpose of this post again is to say (similar to here), that since we are retired, we should NOT be betting on actively managed funds. That’s a game with the odds stacked very much against us. Hard core Nest Eggers stick with index funds and hold only two stock index funds. (See Chapter 11, Nest Egg Care.)
Don’t get me wrong. I really like Fidelity. All my Nest Egg is there. The web site and customer service is terrific. My single largest holding in my portfolio is Fidelity’s US Total Stock Market Index Fund, FSTVX (the lower cost version of FSTMX). Over this past year or so, Fidelity has slashed the Expense Ratio on FSTVX and other index funds to be as low or lower than the comparable fund at Vanguard. That’s darn low. (Full disclosure: I also hold some FTIPX as described here.)
But Fidelity made its reputation on actively managed funds, ones with managers who try to pick the winners from the losers and therefore outperform. The most famous Fidelity fund, the Magellan® fund (FMAGX), more than doubled the returns of index funds for many years and in 1990 was the best performing mutual fund in the world. Peter Lynch ran the fund, and he retired in 1990, and performance since then has been worse than mediocre. Contrafund® (FCNTX) was a rocket ship in the 1980s and 1990s in particular. Low-Priced Stock (FLPSX) was another.
But as these funds outperformed, money poured in from new investors and transformed the size of these funds and the character of what they can invest in. Contrafund now has to invest in very large companies to deploy its +$120 billion under management. It owns more than $8 billion of Facebook. Only seven of those 46 funds have more than $8 billion of total assets to invest.
The question: How do these historic funds and all Fidelity actively managed funds perform relative to their peers over the more recent past? Answer: It’s not good. It makes far more sense to me to own FSTVX and be done with it .
Here’s the data. For many years, I’ve subscribed to a monthly newsletter that gives investors information on Fidelity and its funds. I really liked it when I believed in the power of actively managed funds. Now that I’ve changed to a hard core Nest Egger (I only invest in index funds.), I still subscribe. But I view all the detail of fund performance differently now.
Each month the newsletter displays a performance table for every Fidelity fund: it shows the return in the most recent month, year-to-date, the last three months, and over the past one, three, five and ten years. It’s a lot of information in one big table. I count more than 225 actively managed funds!
I show the 10-year results for 46 actively managed, general US stock funds in a table you can download. Most all of us have an investment horizon far longer than 10 years, and that’s what I’m interested in: which funds have demonstrated that they perform better than their peer index fund over the long haul. I certainly am not motivated to read the tea leaves in one or three-year performance trends, for example.
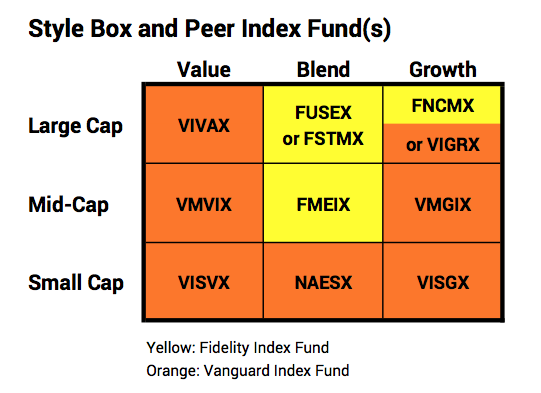
The 46 are grouped by style, and the table includes the returns for the peer index fund for each cell. Fidelity has a peer index fund(s) with a 10-year record for three of the cells in the style box, highlighted in yellow. I use the Vanguard index fund, highlighted in orange, in the other cells.
.

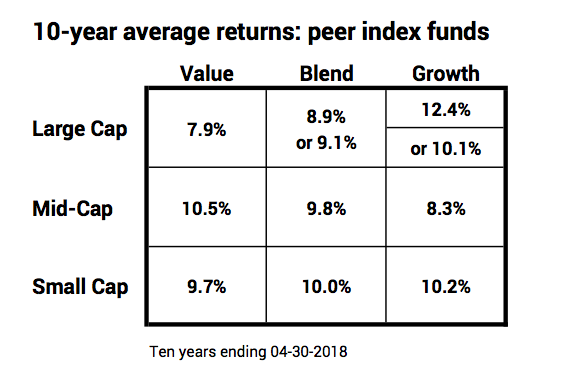
Ten-year returns for the benchmark index funds vary in the cells. Over time, those that are above and below average will change. For example, many would suggest that history tells us that Value is the place to be to do better than average, but Large Cap Value was the poorest performing over the past decade. Just because that cell was low does not tell us anything about how it will rank in the next decade. It’s anyone’s guess. (Large Cap Stocks are about 80% of the total market value of the market; the mid-cap and small cap cells represent much smaller slices of the total; the cells won’t simply average to the total market return, which is the 9.1% for FSTVX.)

Here’s the performance story: Let’s organize this by Large Cap, Mid-Cap, and Small Cap. You can download a more detailed summary table here. Print it along with the other sheet you downloaded. Set them side by side and you’ll have a shortcut understanding of the charts and text below.

LARGE CAP: The top performing fund in the Large Cap cells has been closed to new investors for over five years. In terms of the remaining funds that you can invest in now, its just two of 27 that beat the peer index funds Fidelity identifies. Using a Vanguard index fund as the peer for one cell rather than the one Fidelity uses results in five of 27 that outperformed.
• Large Cap Growth. Fourteen Fidelity actively managed funds are in this cell of the style box – double (or more) that of any other cell. Fidelity’s peer index fund with 10 years of performance is its Nasdaq Composite Index Fund, FNCMX. With FNCMX as the peer, this cell at 12.4% is clearly the best cell over the last ten years. Two funds of 14 outperformed FNCMX: FDGRX and FOCPX. These two have a greater weight of technology stocks than any of the other actively managed funds; they are also the two most volatile funds out of all 46. FDGRX has been closed to new investors for over five years. The summary is that two of 14 performed better, but you can only invest in one as a new investor. You could consider that as one in 13. Not a terrific batting average.
One could argue that the Vanguard Growth Index (VIGRX) is a better yardstick for this cell. VIGRX is closer to the market weighted average of 30% for technology stocks vs. 49% weight in FNCMX. Using VIGRX as the peer, we find that five funds outperformed, and four of them are open to new investors. That’s 4 of 13 that you can invest in now; not good, but not nearly as bad.
• Large Cap Blend. Fidelity has one of seven funds that outperformed, FLCSX, and it’s open to new investors. (But it has trailed its peer index funds over the past one, three and five years; not shown.)
• Large Cap Value. None of the seven Fidelity funds outperformed. Zero for seven.
MID-CAP. Fidelity had no actively managed Mid-Cap funds that outperformed Growth, Blend, or Value peer index funds. That adds to zero for seven.
SMALL CAP: Small Cap Growth, Blend, and Value. Fidelity has a fund that outperformed in each cell, but each is closed to new investors. Two of those three have been closed to new investors for more than five years. So, you could call it three of six or perhaps zero for the three you could actually invest in.
“SPECIALTY” funds did not perform close to the level of any of the index funds used in the style box. Zero for five.

[Why are the highest performing funds (with a few exceptions) closed to new investors? Answer: they’re closed to best preserve their high ranking; without those high rankings the story that some actively managed funds outperform unravels. (One can always compare a fund to the wrong peer index fund, and some do that; but that’s not playing fair.)
My thinking is that Fidelity wants those funds to shine in a ranking similar to that on the sheet you downloaded (those highlighted in green on the table). Fidelity choses to restrict the inflow of funds (at the cost of lower management fees they collect) to avoid changing the nature of the companies the fund must invest in and therefore depressing future fund returns. Even so, one of these four funds obviously had its years of dramatic outperformance more than five years ago: it’s well below its peer index funds for the one, three, and five year periods. Unless it gets on a far better trajectory, that year or years of great performance will roll beyond ten years in the past, and it will look very ordinary.]
Conclusion. I’ve been a fan of Fidelity for many years. All my nest egg is there. It has had three actively managed mutual funds that were rocket ships in the past, dramatically outperforming their peer index fund. But those past rocket ships and the others that one can really invest in now (excluding the funds closed to new investors) just look like normal actively managed funds – there’s nothing really to indicate that they will outperform and lots to indicate that the overwhelming number of them – perhaps 95% of them – will underperform. I’m sticking with the simple US Total Stock Market fund, like FSTVX.
Fidelity and Vanguard are registered trademarks of their owners.