Different decisions lead to the same level of SAFETY for your financial retirement plan.
Posted on August 10, 2018
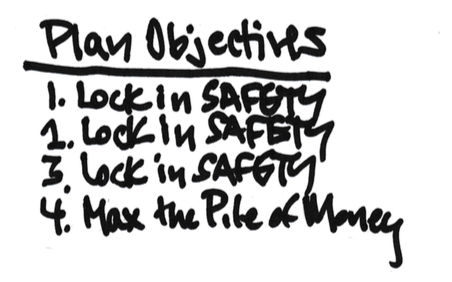
The top objectives for our financial retirement plan are Safety, Safety, Safety. We don’t want to run out of money if we face HORRIBLE future financial returns. And then at our chosen level of safety, we want to maximize a potential Pile of Money we would have if the sequence of returns we face is more normal, not most horrible.
We all make (knowingly or unknowingly) three key decisions that determine the safety of our financial retirement plan. And these decisions also affect the Pile of Money. The decisions we make interrelate, and different decisions can result in the EXACT SAME level of safety. The purpose of this post is to show how they interrelate.
These are the three key decisions:
• Spending Rate
• Investing Cost
• Mix of stocks and bonds
Safety of your financial retirement plan can be defined terms of the probability of never depleting your portfolio. The most important part of Safety is a guarantee of many years of no chance of depleting your portfolio. A Retirement Withdrawal Calculator (RWC) tells us the fewest number of years before our portfolio would deplete based on the worst sequence of future returns that it assembles. After that first point of depletion, an RWC counts of the number of sequences that deplete each year and calculates the year-by-year probability of failure.
The plot of the year-by-year probabilities looks like a hockey stick. The shaft is the number of years of no chance for depletion. You are safe when you LOCK DOWN the number of years you want with no chance of depleting your portfolio. You LOCK DOWN with your three key decisions.
Your decisions to LOCK DOWN safety also affect the Pile of Money, the amount of money that you would accumulate if you faced a more normal sequence of return. I display the size of the potential Pile of Money in the tables in this post. I’ll cover how I got to the Pile of Money in the next post. You objective is to LOCK DOWN safety and then maximize the Pile of Money at that safety mark.

========
The simplest way to understand the three decisions is to first fix the length we want for the shaft of the hockey stick: our desired level of safety. For this post I’m setting the length of the shaft at 19 years. That’s what Patti and I picked at the start of our plan for our spending in 2015. (See Chapters 3 and 4, Nest Egg Care (NEC).) (It’s fewer years now; we’re older!)
How will we understand the effect of the decisions? 1) We’re going to see how changes in Investing Cost affect the spending rate that gives us a 19-year shaft length. The spending rate that gives us the 19-year shaft length is our Safe Spending Rate (SSR%). 2) We repeat by changing Mix for the cases that again have the same 19-year shaft length.
This spreadsheet (pdf file) is a baseline for reference. This shows the results for the decisions for our plan (Patti and me). You see the 19 years of no chance for depletion on the most horrible historical sequence of returns I can find. The SSR% shown is 4.5%.*
You can download this actual spreadsheet and input the numbers I use in this post and confirm the results I cite. You likely have a different number of years you want for no chance for depletion; you can input the decisions you’ve made for your plan. I’d always refer to FIRECalc before making any final decisions, though.
========
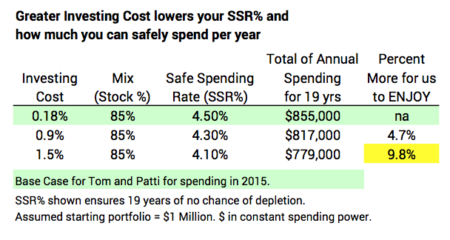
I first show what happens to SSR% from increased Investing Cost. I show two other levels of Investing Cost: .9% is about the average Expense Ratio for Actively Managed mutual funds; the 1.5% is likely closer to the average Investing Cost incurred by retirees when one adds in the percentage who incur advisor fees. You can see two effects of greater Investing Cost:
1) Greater Investing Cost always lowers the SSR% and therefore would lower the amount of money that Patti and I would be able to spend on ourselves. See Table below. Because of our low Investing Cost and therefore greater SSR%, Patti and I can spend 10% more each year relative to someone who decides on 1.5% Investing Cost.
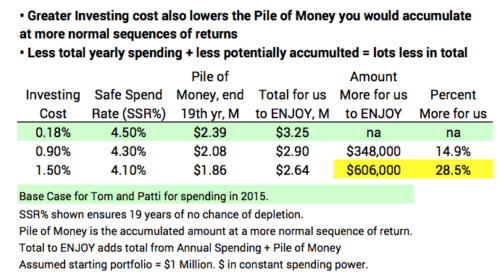
2) Greater Investing Cost always shrinks the Pile of Money that would accumulate at more normal returns. See Table below. At our low Investing Cost, Patti and I would have +$600,000 MORE per starting $1 million over the 19 years than someone who incurred 1.5% Investing Cost. Wow. That is an average of $32,000 MORE per year over the 19 years relative to our first year of spending of $45,000. Again, these numbers are in constant spending power.
It should be obvious. The first decision you want to make for your retirement plan is to COMMIT TO REALLY LOW INVESTING COST: you just lose BIG TIME from high Investing Cost.
========
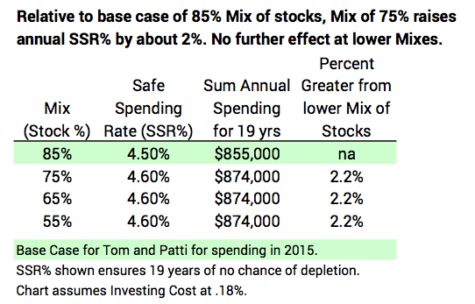
We next must understand what you get (and give up) from different Mixes of stocks vs. bonds. I’m going to display the results assuming you’re going to build your plan on really low Investing Cost. Let’s stick with .18% for this although it’s easy to be lower. The baseline is our plan of Mix of 85% stocks.
A lesser mix of stocks gives a small boost to your Safe Spending Rate (SSR%). See Table below. The other three cases in the table result in the same 19 years of stick length. In all those cases the SSR% increases to 4.6% from 4.5%. This translates to a 2% increase in spending. That first increase in SSR% comes at Mix of 75% stocks, and then that’s it. You get no more improvement with lower mixes of stocks.
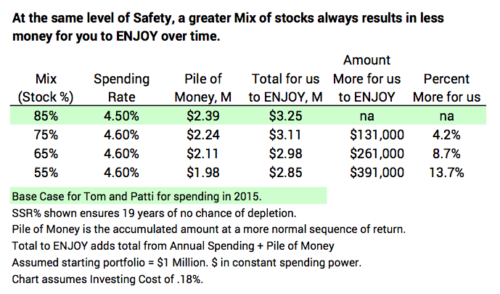
For the same level of Safety (stick length), you are always better off with a greater Mix of stocks. See Table below. The tradeoff for Patti and me was easy. The question we faced was, “Can we accept 4.5% spending rate rather than 4.6%? Can we accept $80 per month less spending ($1,000 per year) with the prospect of perhaps $130,000 more in total for us over time?” That’s trading off $1,000 per year vs. the potential of $7,000 per year at the same level of safety. Answer: “YOU BET!!!” That’s what led to our Mix of 85% stocks. (Hey, I’m Okay with a decision of 75% stocks, but less than this . . . what are you thinking?)
Conclusion: Three key decisions lock in safety of your financial retirement plan: spending rate, investing cost, and mix of stocks vs. bonds. You can first decide on safety in terms of the number of years you want with no chance of depleting your portfolio in the face of the most HORRIBLE sequence of future financial returns. Then your decisions on Investing Cost and Mix will determine your spending rate that guarantees the number of years you choose.
You want to commit to a really low Investing Cost; you get NOTHING from high costs. At your desired level of safety (years of no chance for depletion), you are always better off with a greater Mix of stocks.
* I use 4.5% as the spending rate for this spreadsheet. As I state in NEC, we started at 4.4%. As I mentioned in the last post, my spreadsheet gives slightly better results – e.g., a slightly greater SSR% for 19 years – than FIRECalc.