What happened to Vanguard’s Probability of Living Calculator?
Posted on June 12, 2020

Vanguard’s Probability of Living Calculator has disappeared. It’s an important tool for decisions for our financial retirement plan. Vanguard removed it as publicly available on the web and put it on their web site for their customers. Now they’ve removed it from there. I’ve not found a good substitute. This post describes my thoughts to develop and provide a Probability of Living Calculator to help folks think through their decisions for their financial retirement plan..
== It’s an important tool ==
A Probability of Living Calculator gives you the the percentage chance of living a specific number of years in the future. You get year-by-year probabilities of being alive. That’s much more detail than the calculation of the number of years to reach 50% probability of being alive – your expected life expectancy. See Nest Egg Care (NEC), Chapter 3. I used the Vanguard calculator to decide the number of years Patti and I wanted for ZERO CHANCE of depleting our portfolio. We picked 19 years as our ZERO YEARS. I like thinking we could be worry free for that many years.
FIRECalc is the second essential calculator – a Retirement Withdrawal Calculator (RWC) – that then leads us to three decisions that LOCK IN the number of ZERO YEARS that we pick. One of those three decisions is our Safe Spending Rate (SSR%) and therefore our Safe Spending Amount (SSA) – the dollar amount in constant spending power we could withdraw each year for our spending with no risk for the next 19 years. To me, the worry comes after that point. The monthly, quarterly, or annual ups and downs of the market are not the worry. None of us can control those variations. But we can assure the 19 years of no worry.
It’s time to pull out the image of the hockey stick again as a reminder of that distant point for worry! The future financial risk in our retirement plan looks like a hockey stick, and if you follow the logic in NEC, your financial risk also looks like a hockey stick.

The shaft length is the many years of ZERO CHANCE of failing to be able to take a full withdrawal for our annual spending. That’s the 19 years through 2034 at the start of our plan five years ago. The elbow of the stick is a transition point. That’s the point we want to control. We definitely don’t want it to get shorter. We learn from NEC that we can actually LOCK IN that point and even extend it while we’re retired.
The blade represents increasing year-by-year chances that we can’t take a full withdrawal for spending. Patti and I have a small chance that we can’t take a full withdrawal for spending in 2035; it’s a slightly greater chance in 2036 and so on. But the blade and its angle is not a big worry point in my mind. We’ll know many years in advance if we’ve been riding on a sequence of returns that remotely gets close to that point. (It’s not been close over the last five years.) We can act many years in advance to extend shaft length.
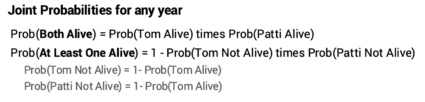
== Both Alive and At Least One Alive ==
The decision of the number future years you want for ZERO CHANCE is straightforward if you are planning for yourself. In my view, it’s your life expectancy, but you can decide differently. The decision is more complex decision if you are planning for two. More probabilities figure in to your thinking: the probability that Both will be alive and the probability that At Least One will be alive. You can only understand these year-by-year probabilities from a Probability of Living Calculator.
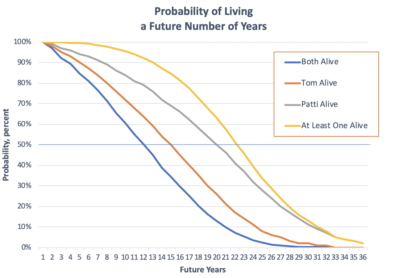
I’ve gotten better with Excel than when I drew Graph 3-3 by hand in NEC. This graph uses the same data for I obtained in late 2014 for our ages then from the Vanguard calculator.
== What number of years for ZERO CHANCE? ==
Patti and I looked hard at the expected number of years that Both of us would be alive. Just 11 years at the start of our plan. That’s where the blue line cross 50% probability. That had a big impact. We thought about that for days. “This says we have a 50-50 chance of both being alive in 11 summers from now. WE HAVE TO GET BUSY TO FIGURE OUT HOW TO ENJOY LIFE WHILE WE CAN.” We knew we wanted to withdraw enough for our spending so that we would be fully enjoying the years we have together. Holding back on spending made no sense.
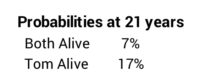
In the final analysis we gravitated toward the expected 21 years that At Least One of us would be alive. That’s where the yellow line crosses 50% probability. But our choice of 19 years made more sense to us. Our thinking was that the survivor would spend much less than when it was the two of us; the chances of depleting a portfolio are much lower with less spending. And the time when it would be just one of us is likely a lot earlier than 21 years: the chance that both of us would be alive in 21 years was just 7%. It was just 17% chance that Tom would be alive.
Our choice of 19 years gave us a beginning SSR% of 4.4% (See NEC Graph 2-7 and Appendix D.). That’s 5% better than the 4.2% for 21 years. That doesn’t sound like that much more, but the added annual dollar amount in our case was a very good mental boost: I translated the amount in my head to mean that we should not worry about how much more we might spent on a nice room when on vacation. Patti bought a few more pairs of shoes and that made her happier. I did not complain. I was happy that she was happy.
== My generalization ==
My rule of thumb is that your SSR% should be based on your life expectancy or the longest life expectancy year if you are planning for two. Social Security’s Life Expectancy Calculator is a good source for life expectancy. The note on your results page states that you may want to think about using a shorter or longer life expectancy for your retirement plan based on your health status, lifestyle – which includes your social-economic status, and family history.
== My first draft of a Probability of Living Calculator ==
I’m in the early planning to produce an easy to understand Probability of Living Calculator so that folks can think through the probabilities of the number of years they have left and how they want to spend them. I think couples need to understand Both Alive and At Least One Alive. “How many more years might we have together? How do we want to spend those years? What are our plans to spend to ENJOY NOW?” My draft of how the output might look on a web site is very similar to the graph I drew above. I’ll post updates on this project.
Conclusion: I used the Vanguard Probability of Living Calculator to decide the number of years Patti and I wanted for ZERO CHANCE of depleting our portfolio – to the point we ran a risk of not being able to take a full withdrawal for our annual spending. I think that’s a critical decision for your financial retirement plan. But Vanguard no longer provides a calculator that helps you think through the number of years you want. I’m in the early planning to produce a replacement calculator.