Oops. Is 2% inflation in sight?
Posted on February 24, 2023
Inflation data for January came out last week and a final piece came this morning. Inflation upticked in January. The picture looks different from last month: I thought we were on track to 2% annual inflation. The January result throws that view out the window: we are tracking closer to 5% inflation. This post displays January inflation and the trend.
I want to track the month-by-month trends in inflation. Increasing and high inflation is not good for bonds or stocks. Decreasing and low inflation is good for bonds and stocks. Ideally we get to the Fed’s target of 2% inflation fairly quickly.
I show several graphs that help me see the trends in inflation more easily. I show two graphs for Consumer Price Inflation (CPI) and a graph for Personal Consumption Expenditures (PCE); this latter measure is the favored by the Federal Reserve. PCE tracks inflation by the changes in consumer purchasing patterns (e.g., perhaps more beans and less beef) and not for a fixed basket of goods and services. Both measures are tracking to annual inflation in the range of 5%.
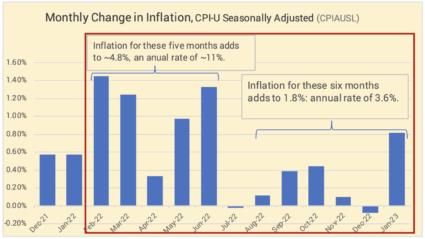
== Most widely reported ==
The most widely-reported measure of inflation is Seasonally-adjusted inflation. This measure of inflation increased by 0.8% in January. The graph shows that the January result messes up the story that we were on track to an annual 2% rate. The 0.80% increase in January is four times the average of the prior six months. The greatest component of increase was energy, +2% for the month. The rate over the last six months adds to 1.8%; that translates to an annual rate of 3.6%; the annual rate for the last seven months is lower.
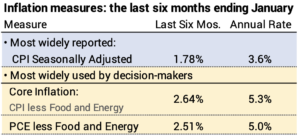
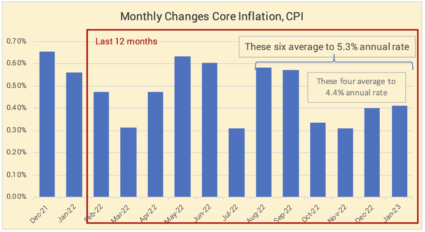
== Key measures that exclude Energy and Food ==
Core inflation excludes volatile energy and food components. Over the past months, it never increased as much as Seasonally adjust inflation, and it has not fallen as much in recent months. The increase in January was +0.40% – half the increase of Seasonally-adjust inflation, above. Removing the energy component had a big effect. Inflation for the last six months has been at an annual rate of 5.3%. The rate for the last four months has been lower, but the pattern, again, does not show a trend that points to an annual 2% rate.
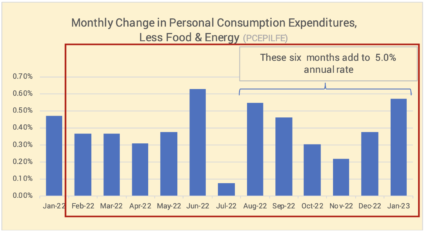
The Bureau of Economic analysis issued the January index for Personal Consumption Expenditures less food and energy this morning. The Federal Reserve Board favors this measure of inflation . The incease in January was 0.57%. Only June 2022 was higher over many past years. The last six months add to an annual inflation rate of 5.0%.
== History of 12-month inflation ==
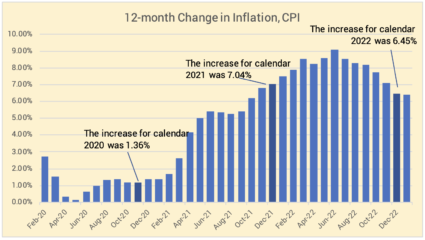
Full year inflation measured by the CPI-U shows that inflation for the last 12 months has been 6.41%. This is a slight decline from last month. The 12-month peak was 9.1% in June.
Conclusion: The Core rate of inflation – that excludes the volatile components of food and energy – was 0.40% in January; the last six months average to 5.3% annual rate. Another favored measure of inflation is Personal Consumpution Expenditures less food and energy. That measure of inflation increased 0.57% in January; only June 2022 was higher; the last six months average to an annual rate of 5.0%. Both are well above the Federal Reserve’s target of 2% inflation.