Our 15% “Pay Raise” Calculation. December 2017.
Posted on December 8, 2017
If you follow the CORE in Nest Egg Care, you Recalculate this general time of year. You may have Recalculated using your 12-month results ending October 31 (like Alice) or November 30 (like me now). Perhaps you will use December 31.
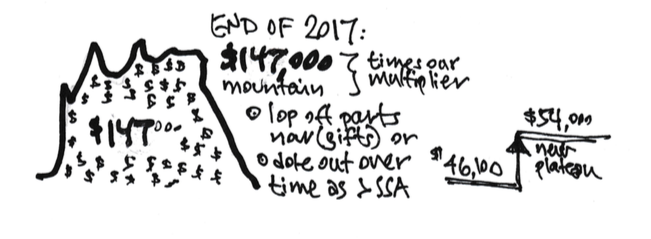
No matter which date you choose* you find you now have a small mountain of cash that is More-Than-Enough for your current spending. You can lop off parts of that mountain as gifts now and/or you can ratchet up to a new spending plateau for the rest of your life (lives) – a healthy pay raise for 2018 and all future years.
Folks who don’t follow the CORE don’t know how to Recalculate, and it’s impossible for them to figure out the size of their mountain after this year’s solid returns. They also won’t know the height of their new plateau. They just can’t get to the correct story: “You can spend (and gift) Much More in 2018 and all future years than you did in 2017.” But we know the story since we know how to Recalculate.
My recalculation (for Patti and me) is on this spreadsheet (pdf). (As reference, you can read about my recalculation a year ago here.)
The work to get to see if we have More-Than-Enough for our current spending is simple. I entered three numbers on the spreadsheet in the cells highlighted in yellow. The speadsheet calculates the rest.
• I first entered the return rates for our stocks and for our bonds for the period ending November 30.** I get those straight from my Fidelity portfolio page when Fidelity updates the 12-month returns ending November 30. They did that in the early hours of December 5 this year. (I have stocks and bonds in separate accounts, so there is no confusion on returns for each.) The spreadsheet calculates +19.0% as our total return for the year. That was obviously driven by high stock returns.
• I also entered the inflation rate for the year. That’s the Cost of Living Adjustment rate stated by the Social Security Administration each October for payments for the upcoming year.
The spreadsheet does the rest once I move the calculations one cell to the right. So, what do we find? Here’s a summary table similar to the one in Nest Egg Care, page 72.)
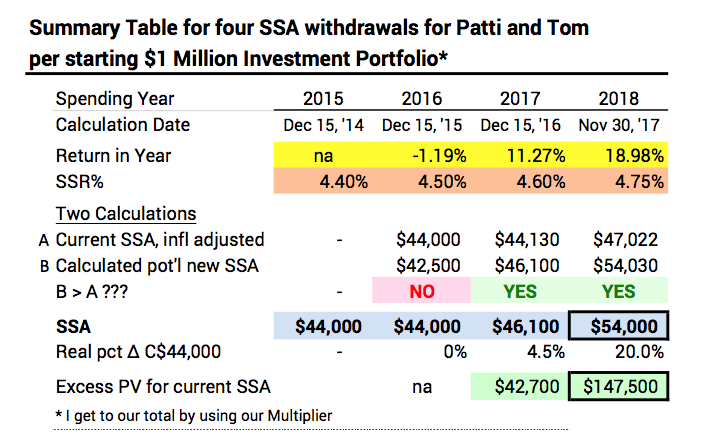
1. The spreadsheet shows that if we chose to only adjust our current spending for inflation, we have over $147,000 more than is needed to support that $47,000 in spending – a small mountain of cash. (And that’s before applying our multiplier.) Wow! Wow! Wow! We certainly could chose to make LARGE gifts this year from that.
Do we lop off all or a portion of that mountain now? (Alice lopped off $25,000 off her mountain this year.)
2. If we don’t lop off any of the mountain now, the spreadsheet shows that our Safe Spending Amont (SSA) per $1 million starting Investment Portfolio increased to $54,000 – $7,900 more per year than last. (I again would apply our multiplier to get the total we can spend.) That’s a real increase of nearly 15% this year and 20% more than the $44,000 we started three years ago. That $54,000 is a whole new plateau: $54,000 in constant dollar spending for the rest of our lives; it won’t ever be worse than that. We’ve left our initial $44,000 in the dust.
You can also see on the table that after the withdrawal of $54,000 our Investment Portfolio is about $60,000 greater now (in constant dollars) than the $1,000,000 we started with. (See the row “Invest Portfolio after withdrawal” and the row below which states the result in C$2014.) That surprises me a bit.
You can also see that I’ve displayed the More-Than-Enough relative to our initial $44,000 Safe Spending Amount. (See cell below the one with $147,531.) That’s saying that if we dropped back to that spending level (which is possible for us to do), we have $187,000 More-Than-Enough.
Those two now have me scratching my head about how long I can wait before I would be forced to sell stocks when they’ve cratered. That time is stretching out to longer than I really think is necessary. Within a few days I’ll have next year’s Safe Spending Amount in cash. (I’ll peel that out monthly to our checking account.) And because Patti wanted an extra Reserve at the start of our plan (See Part 2, Nest Egg Care), I have about two years of spending sitting in short term bonds. That adds up to three years. And now that $60,000 looks like fourth year to me. And that $187,000 strikes me as a huge cushion. I didn’t think I’d wind up like this. I feel like I’m wearing two belts and two sets of suspenders.

The question is: should we lower our Reserve (increase our Multiplier)? Patti is beginning to understand: that extra Reserve she wanted is looking superfluous now. But I’ve decided to wait a year. We certainly don’t have pressure to lower the Reserve (raise the Multiplier) to be able to spend more in 2018. I’ll look at this again next December: might be a big year for gifts.
* Pending a wild decline over the next few weeks in December for those who recalculate based on December 31.
**You can see at the top of the sheet that I used November 30 as year-end this year as compared to December 15 in prior years; it was too confusing to get 12-month return rates at a mid-month point. It’s much easier to get those rates for every November 30. The change this year means I’m using return rates for 50-weeks: December 15, 2016 through November 30, 2017.