Is this “Terrific” Large Growth Fund for you: JENSX?
Posted on February 21, 2020

This article, “A Terrific Large Growth Fund” at Morningstar (M*) concludes: [JENSX] “Jensen Quality Growth’s managers have demonstrated stock-picking acumen over a long period of time.” We nesteggers know that it is very rare that a fund will outperform its peer index fund over a decade – no more than 1 in 16 do. But is JENSX one of the very few with a track record that tells us that it will beat the market in the future? The purpose of this post is to explain why I would NOT want to own this fund, and you shouldn’t want to own it either: I’d conclude future performance will be no better than its peer index fund.
== Why this article? ==
The article is an example of the kind of report you could receive on more than 1,000 mutual funds if you were a Premium Member to Morningstar: cost of about $200 per year. I sometimes come across similar articles that recommend an actively managed fund. I’m curious. Is the fund recommended really a world beater? I look first at the fund’s Expense Ratio and then at performance on the M* site: M* compares the historical performance of any fund to its peer index fund. Does JENSX have low costs that aren’t too great of headwind to overcome and a solid track record that says it’s very likely to outperform in the future?
== Expense Ratio ==
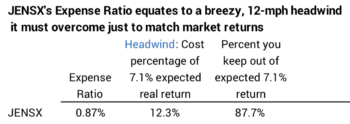
I first look at a fund’s Expense Ratio to judge the headwind it has to overcome to deliver a return better than the market. I find Expense Ratio on the M* Quote page; that’s the page you get after you enter the fund’s ticker symbol in the Search bar on M*’s home page. Morningstar states JENSX’s Expense Ratio is .87%. That .87% is 12% of the expected real return of stocks of 7.1% per year (.87%/7.1%). I like to think of that as a breezy, 12-mph headwind that JENSX has to overcome every year or over the years if it is to deliver better than market returns.
I want to compare that 12-mph head wind to that of its peer index fund. M* says JENSX falls into Large Cap Growth category; that make sense from the “Growth” in name of the fund. But the M* display on the Portfolio page tells me JENSX is closer to Large Cap Blend. This could be an aberration in the snapshot of holdings as of the end of January. But I’m going to use Large Cap Blend as the benchmark for comparison. I’ll show the comparison to Large Cap Growth in a bit; it’s not as good.
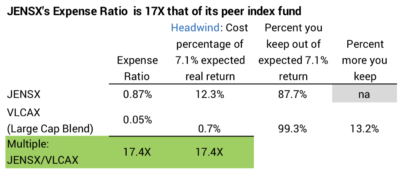
The Expense Ratio for the index fund I use for Large Cap Blend, VLCAX, is .05%. That’s .7% of the 7.1% expected return (.05%/7.1%). That is calm conditions of less than 1 mph . 1/17th that of JENSX. It’s much easier to VLCAX to deliver a net return that’s close to the total the market return. I’d reliably keep +99% of what the market returns, but I’d never get more than the market return.
== Stock Picking ==
JENSX’s can only deliver a return to an investor that’s better than a peer index fund or better than the market if it’s its stock picking skill is better than others. It’s a zero-sum game: the managers of JENSX only win that game by beating other actively fund managers. JENSX can overcome its 12% headwind to match its peer index fund if some other managers perform 12% worse. Winning that game with any consistency is tough. Is JENSX up to it? The data in this Table says, “No, not really.”
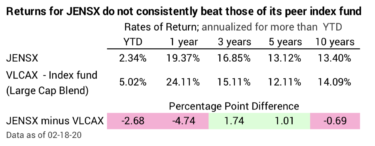
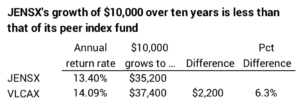
JENSX does beat VLCAX over some holding-periods but not others. Recent performance has really dragged down the results of longer holding periods. Over a 10-year holding-period JENSX lags VLCAX by about .7 percentage points per year. That seemingly insignificant difference in return rate cumulates: you’d have 6% more from VLCAX than from JENSX at the end of ten years. Overcoming that deficit in the future won’t be easy.
== What if the benchmark is Large Cap Growth? ==
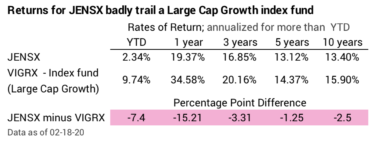
JENSX’s performance is worse if I compare it to VIGRX, the Vanguard Index fund for Large Cap Growth. The table shows JENSX trails badly over every holding-period. Over ten years it trails by more than two percentage points per year. The difference in compound growth is 20%. That’s REALLY difficult to overcome in the future.
== Would I buy JENSX? ==
Nope. I don’t see anything about JENSX that excites me. I can’t see why anyone would buy it.
== Would I sell JENSX if I owned it? ==
I sent the link to the M* article to my friend Jay with the comment, “What is M* thinking? Why would they recommend this fund? Look at that Ho-Hum performance. Who would buy this?” Jay responded, “I already own it in my taxable account!” Hmmm.
If Jay would not buy JENSX now, should he sell it now? That decision takes a bit of thought and math. In the next week or so I’ll explore that question, “When should you sell an actively managed fund and buy its peer index fund?”
Conclusion: We all see articles that recommend actively managed funds. When I dig into the funds recommended, I’m usually unimpressed. The costs that these funds have to overcome are high. They can only overcome the costs by winning the stock picking game, and that’s a zero-sum game: an active fund wins only when other active funds lose. Very few actively managed funds are able to overcome their costs to deliver the net return of a peer index fund. Performance may have looked good in the past, but that good performance just does not persist.