Is inflation slowing?
Posted on May 13, 2022
The purpose of this post is to provide information on recent trends in inflation. We’ve all been hit with inflation: it hurts our spending power; both stocks and bonds react negatively to increasing inflation. The last time it was this high was about 40 years ago. I have no idea of when it will come down closer the Federal Reserve’s target of 2% per year. I suggest that we’ll see lower annual rates of change at least for the next two months. I’d guess we nest eggers – especially those who recalculate at the end of November like I do – will be seeing ~6% adjustments for inflation in our gross Social Security benefits and our Safe Spending Amount for 2023 (SSA; see Chapter 2, Nest Egg Care). That will give us the ~same spending power in 2023 as in 2022.
== Recent history ==
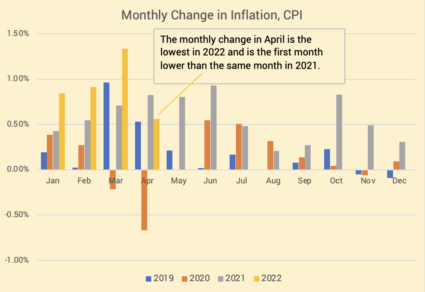
I plot the monthly change in inflation for the past 3 1/3rd years. The April increase in inflation was .56%. That’s the lowest monthly change this year; it’s less than half the 1.33% change in March. April is the first month in 2022 that the change has been less than the change for the corresponding month in 2021.
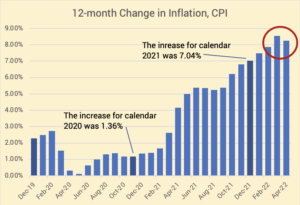
I plot the 12-month change in inflation for each month for the last 2 1/3rd years. Inflation over the last 12 months was 8.26%. The 12-month rate has steadily increased for ~20 months. (There was a slight decline for 12-month the period ending August 2021.)

== The future ==
You can see from the first graph that for the next two months we’ll be comparing the monthly change in inflation to the highest two-month change in 2021: 1.74% for those two months from the .80% increase in May and .93% increase in June. Assuming the monthly changes for May and June will be less than in 2021, the news will be that the 12-month rate is falling.
Then we’ll be comparing monthly changes to the lowest three-month period in 2021: July, August and September. Inflation averaged 0.3% per month, half of the rate this past month. The 12-month inflation rate may climb in those months.
Social Security calculates its Cost-of-Living Adjustment (COLA) in October based on the average change in inflation for the three months July, August and September. It uses a different measure of inflation (CPI-W) than is widely reported (CPI-U). CPI-W increased 5.9% for 2022, and that was a greater increase than would have been calculated using CPI-U.
Assuming no big turnaround in current market performance, our annual Safe Spending Amount for 2023 will only increase for inflation. We won’t see a real increase, unlike the ~10% real increases all nest eggers averaged over the last two years.

Conclusion: We’ve all been hit with inflation: it hurts our spending power; both stocks and bonds react negatively to increasing inflation; that’s a double-whammy. The last time inflation was this high was about 40 years ago. I have no idea of when it will come down closer to the Federal Reserve’s target of 2% per year. We clearly have a way to go. I suspect we will see 12-month rates decline for the next two months; it will be tougher sledding for the three months after that. I’d guess we nest eggers – those who recalculate at the end of November like I do – will see ~6% adjustments for inflation in our gross Social Security benefits and our Safe Spending Amount for 2023.