How have you isolated yourself from bad volatility in your portfolio?
Posted on December 20, 2019
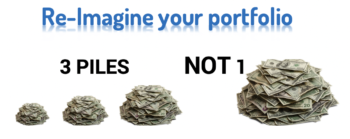
Our portfolio – your portfolio – shouldn’t be viewed as one big pile of money. For almost all days in the year I can’t help but look at our total as one big pile: I see the total amount Patti and I have on the portfolio page after I log in at Fidelity. But I really don’t want to think about it as one big pile or just two piles of stocks and of bonds. I want to think about it as three portfolios grouped in different holding periods – the number of years on average that we’ll hold stocks and bonds before we sell them for our spending. Each portfolio has a different mix of stocks and bonds and therefore different expected return and volatility: low, medium and high on both counts. The purpose of this post is 1) to look at the past five years of return rates and volatility in three re-imagined sub-portfolios for our Investment Portfolio and 2) to remind ourselves how we further isolate ourselves from bad volatility of returns.
== My analogy of bottling wine ==
I can easily recast our stock and bond returns into three groupings, but I imagine this task differently. I want to have a physical image of our portfolio arranged into holding periods. I’ve settled on the analogy that our portfolio is wine and that every December 15 I bottle very properly aged wine to consume in the upcoming calendar year. That is what I do: I sold securities this month equal to our Safe Spending Amount (SSA) for 2020; after withholding taxes, I’ll pay out the net from our Fidelity account to our checking account each month. Patti and I receive a case of wine each month to consume.
I imagine that Patti and I have three groupings for our wine: two groups of wine barrels that I imagine we keep in our garage. Each barrel holds one year of wine that I will bottle in December and consume in the next year. One large vat is out back and holds the rest of our wine. Last Sunday, December 15, I imagined I went out to the garage to bottle the wine in the barrel for our 2020 spending. (You can read more detail of how I spent two prior imagined “Bottling Days” here and here.) That barrel was in the #1 position of the ten barrels. Here’s the listing of the barrels and detail information that I’ve marked on each.
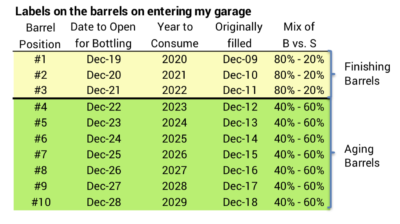
I group the first three as Finishing Barrels: each is 80% bonds and 20% stocks. I group the next seven as Aging Barrels: each is 60% stocks and 40% bonds. All the rest – it will be more than ten years before we bottle and drink any of that – is in a Large Vat and is 100% stocks.
I like to think how long wine that we drink has aged and the care we’ve taken to age it properly. The wine that we will drink for 2020 was first filled with wine from the Large Vat in 2009. Some of that wine had been in the vat for 30 years. That barrel then aged for seven years at 60% stocks and 40% bonds and then three years at 80% bonds and 20% stocks. That’s quite a process.
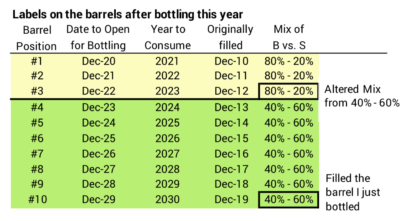
At the end of my work day, the lineup of barrels looks the same as it was at the start of the day, but I’ve rolled the 2021 barrel to the #1 position. I moved the empty 2020 barrel to the back of the line in the #10 position. I filled it from the vat. I adjusted the mix to 60%-40% and marked “Bottle in Dec-29 to drink in 2030” on it. I also adjusted barrel #3 to be 80% bonds and 20% stocks rather than 60% stocks and 40% bonds.
== The pattern of returns and volatility ==
Do the the mixes of stocks and bonds in my three groupings make sense? (You can see the detail calculations that lead to the two summary tables here. I’m using our 12-month returns ending November 30 for this table.) The three groups follow the expected pattern of returns that I would expect. Finishing Barrels are about 2.3 percentage points less in annual return than Aging Barrels. Aging Barrels are about 2.3 percentage points less in annual return than the Large Vat.
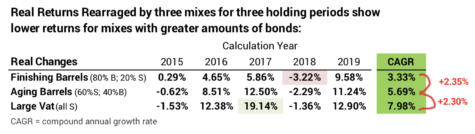
The three have generally followed the pattern of lower to higher volatility that I would expect. My crude measure of volatility is the percentage point difference between best to worst annual return.
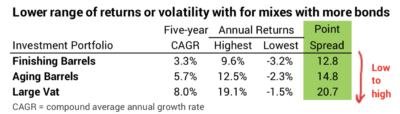
A few of the details surprise me. I would not expect to find that a finishing barrel had the largest negative return over five years; that’s the -3.2% in 2018. I would have expected the 13-point spread for Finishing Barrels to be MUCH LESS than that of the other two; that large point spread is due to the high return for bonds this year, and that’s a good thing.
== We want further isolation from volatility ==
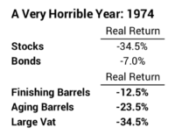
None of these five years come close to a Most Horrible year. Oh, Patti and I are really happy about that. You should be, too. 1974 was the worst or close to the worst year in history. We’re looking at a -12% real return with a mix of 80% bonds! And those others! That was ugly.
When I think that a year like that is possible, I always think about the off-the-top Reserve that Patti and I exclude from our calculation for our Investment Portfolio. (See Chapters 1 and 7, NEC.) I will use the Reserve for our spending in a year and completely dodge having to sell securities in a year that is remotely close to 1974. When I use the Reserve rather than selling stocks when they’ve cratered, I’m buying time for our Investment Portfolio to recover.
Patti insisted on two years of spending in Reserve. (See The Patti &Tom File at the end of Part II, Nest Egg Care (NEC). That means right now we can wait three years before we would have to sell stocks: spending for 2020 is in cash/near cash; we could use the Reserve for spending in 2021 and 2022. The first date I might have to sell stocks is December 2022. And I can stretch that date: I likely would see poor returns well before our caclculation date at the end of November and we could easily lower spending – that’s fairly painless for us given our real 22% the pay raise over the past five years. And I am now renewing our HELOC (Home Equity Line of Credit) that I could tap to wait longer. That ability to hold off for more than three years gives me the sense that we’ve really isolated ourselves from bad stock market volatility.
Conclusion. We Nest Eggers shouldn’t view our portfolio as one big lump that rises and falls with market returns. That tends to make us too sensitive and too emotional when we are hit with bad volatility in stock returns.
It helps to imagine our portfolio in parts related to different holding periods. It’s hard to display your holdings in your brokerage account that way. But that’s easy to do on a spreadsheet when you separately track your stock and bond returns. Each holding period should have an appropriate mix of stocks and bonds. I like my arrangement of three holding periods that start with 80% bonds and 20% stocks and end with 100% stocks.
The money invested for the shortest holding period will have lower but more stable returns. The money invested for the longest holding period will have higher but more variable returns; we know that if we’re hit (or when we’re hit!) with bad volatility of stock returns, we have many years to recover.