What’s our calculation of Safe Spending for 2019?
Posted on December 7, 2018

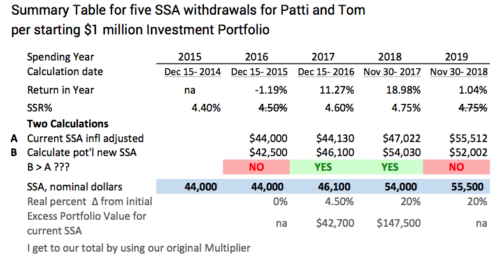
I knew this before entering our 12-month returns ending November 30 into our calculation sheet: our Safe Spending Amount (SSA) – the amount that results in zero probability of depleting our portfolio through 2034 (Patti’s age 87) – is unchanged in spending power for 2019. It just adjusts for inflation to a total of $55,500 relative to $1 million initial Investment Portfolio value – an assumed base case – in December 2014. I’ll use our Multiplier (the one we set at the very start of our plan) to get to our total. The purpose of this post is to show our detailed calculation sheet and add comments. (You find a similar calculation sheet you can use in the Resources section above.) Here’s a summary table. In the discussion below I’m referring to the detailed calculation sheet.
==== Inputs I entered ====
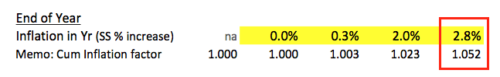
I entered 2.8% for inflation for 2018. That’s the highest in four years. Inflation distorts our understanding of what’s really happening to our portfolio and what we can safely withdraw for spending. Inflation is not our friend; historically many of the worst real annual returns for stocks and bonds have been in periods of high and increasing inflation. I don’t consider 2.8% high, and I don’t read that inflation is running away from us.
I entered our return rates for stocks (+1.40%) and bonds (-.99%). (You can read more detail here.) The spreadsheet calculates our 1.04% total portfolio return for the year. This is the second lowest nominal return in four years, but the real return of -1.71% is the lowest. I calculate that Patti and I have experienced 5.9% compound real average annual return. That’s less than our expected return of 6.4% given our mix of stocks and bonds and based on expected 7.1% real return for stocks and 2.3% for bonds.

All of us have avoided the bombshell of a year with big negative returns. A bombshell by my yardstick is a one-in-ten-year bad event – a bad return rate that is 10% probable in any year. (See Chapter 7, Nest Egg Care.) Bombshells – large negative stock returns in particular – can really hurt since we are also withdrawing for spending each year. All of us have dodged a bombshell for more than a decade now. That’s why we all should be happy campers: we all have avoided the emotional stress that comes with bombshells; we all have larger portfolios than we otherwise would.
You may note that the SSR% is unchanged for this year’s calculation (4.75%). Our SSR% is based on Patti’s life expectancy. Every year we live, the number of years of our remaining life expectancy decreases, but the decrease isn’t a full year. The probability of living calculator that I use rounds the years of remaining life expectancy to whole years. That means in most years life expectancy decreases by one year for each year one lives, but in some years life expectancy doesn’t decrease at all. The effect means our years for zero probability of depleting our portfolio is now through 2034. It was 2033. (The next time we’ll see this effect is in 2025.)
==== Calculations and Results ====
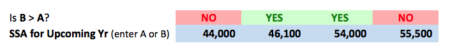
Our portfolio returns over the past four years translated to two years where our SSA increased for inflation (NO) and two years where it increased by more than inflation (YES). All nest eggers would have seen the same pattern. Our $55,500 SSA for spending in 2019 is 20% greater in spending power than it was when we started our plan.
We’ve withdrawn four years of spending and have more than we started with. On the basis of an assumed $1 million Investment Portfolio at the start of our plan, Patti and I have withdrawn $186,700 in spending power in four years – spending years 2015 through 2018. Right before this upcoming withdrawal the spending power of our portfolio is $1,041,000. We started with $1 million. We’ve withdrawn $186,700. We have more than $1 million. Ooooh, I like that. That’s a very good starting pattern for a retirement plan and the obvious reason why we can spend more now than we could at the start.
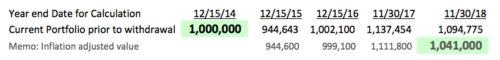
That $1,041,000 means that if we now reduced spending back to our original SSA ($44,000 in constant spending power per starting $1 million – and this would not be hard for us to do), we would have a plan that would stretch the first possible year for depletion to almost 20 years from now – to the end of 2038. That would be to Patti’s age 91 and my age 94.
Conclusion: Our plan marches on. The calculation, based $1 million initial Investment Portfolio four years ago, tells Patti and me to withdraw $55,500 for spending in 2019; that’s the same amount as in 2018 adjusted for inflation. It’s still 20% more spending power than at the start of our plan. Over the last four years, we’ve withdrawn $186,700 in spending power. Before this upcoming withdrawal for 2019 spending, our portfolio has more total spending power than at start of our plan. We are happy about that.