Is Social Security using the right index to measure inflation for retirees?
Posted on October 20, 2023

Since 1982 the Bureau of Labor Statistics (BLS) has tracked what they call an experimental index for Americans age 62 and older, CPI-E. This index weights components of inflation differently than the index that Social Security (SS) uses to calculate its annual Cost of Living Adjustment (COLA) – CPI-W. This post compares what SS COLA would be if SS used used CPI-E rather than CPI-W. In summary, COLA would have accumulated to about 1.5% more over the last ten years had SS used CPI-E rather than CPI-W. Don’t hold your breath: I do not see strong support for changing the calculation to CPI-E rather and CPI-W.
Details:
BLS tracks a number of inflation indices. I’ve shown several in recent months (See most recent here). SS uses a measure CPI-W (Consumer Price Index for Wages and Clerical Workers) to calculate COLA. Medicare premium tripwires announced in September and IRS tax brackets for 2024 that will be announced this month adjust based on CPI-U (Consumer Price Index for all Urban Consumers). Here’s the data for CPI-E.
== CPI-W and CPI-E differ ==
The CPI indices are based on inflation of a market basket of components – 460 of them – and a percentage weight for each component; weights for an index are updated every year or so. Each index differs in their weights of the components. CPI-E differs from CPI-W primarily by the weight of healthcare costs. It’s 11.3% weight in CPI-E and 5.6% of the weight in CPI-W. Since healthcare costs have increased faster than many other components of inflation over time, the index for CPI-E has increased faster than CPI-W.
Over the last 30 calendar years, CPI-E has increased more than CPI-W for 23 years. See detail on some of differences in components and a graph showing calendar year difference in inflation here.
SS calculates COLA based on the annual change in CPI-W for average for the July, August, and September. It then rounds the annual change to the nearest .1 percentage point. I show the calculations for COLA for the last 10 years for CPI-W, CPI-U and CPI-E:
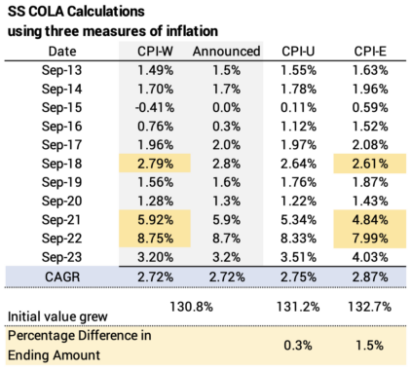
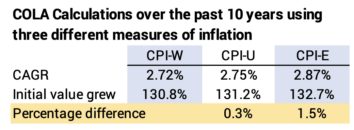
• Even though actual COLA is rounded to the nearest .1 percentage point, it matches COLA when calculated to .01 percentage point over the past 10 years – 2.72% Compound Annual Growth Rate (CAGR).
• COLA using CPI-W has been greater than COLA using CPI-E in three years of the past 10 years and less than CPI-E in seven. Those three years fall in the last six.
• COLA over 10 years using CPI-W calculates to 2.72% CAGR. COLA calculates to 2.87% CAGR if SS had used CPI-E. That’s .15 percentage point difference per year.
• The .15 percentage point per year means COLA would have been 1.5% greater in 10 years had SS used CPI-E. If you started SS ten years ago and your SS next year is $30,000, it would have been $30,480 if SS had used CPI-E.
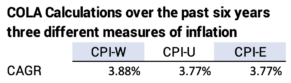
• CPI-W has been greater than CPI-E in three of the last six years. CPI-W calculates to greater about .1 percentage point greater COLA per year that CPI-E. If you started SS six years ago, your 2024 benefit is more because SS used CPI-W and not CPI-E.
Conclusion: Every now and then I see an article stating the adjustment for inflation in Social Security benefits is not accurate for retirees. This is true when one compares the index that is used – CPI-W – vs. an index that is geared to folks over age 62 – CPI-E. Over the last 10 years, the difference in total SS benefits is about 1.5%. If you’ve received SS for 10 years and your benefit this next year is $30,000, it would have been $30,450 if the calculation had been based on CPI-E.
In the last six years, it’s the reverse. CPI-W has been greater than CPI-E in three of those years. If you’ve received SS for six years, your benefit now is greater than it would be if the calculation used CPI-E.