How badly did actively managed funds perform relative to index funds in 2018?
Posted on January 18, 2019

The answer: it looks very bad for funds and fund families that pride themselves on being better than average. That’s what I conclude as I look over the results of Fidelity funds and the flagship fund from American Funds. This post highlights the poor performance of a number of popular actively managed mutual funds in 2018 and over the last decade. My conclusion is that you just can’t afford the poor performance of actively managed funds. If you haven’t done so, immediately switch to index funds in your retirement accounts. You have no tax consequences to do so.
==== Active must underperform ====
The simple math says that in aggregate actively managed funds have to underperform by their higher costs (expense ratio). I subscribe to a newsletter that shows results of Fidelity funds. (I’ve had my money at Fidelity for decades; I own only two Fidelity index funds now, FSKAX and FTIHX.) The January newsletter showed the 2018 performance of 44 actively managed US stock funds and summarizes the fact that these funds averaged -7.5% in 2018 as “sobering”.
Compare this to FSKAX (US total stock market index) at -5.5%. Those 44 averaged two percentage points worse; that’s more than the average expense ratio of those funds – less than one percentage point. That means the active managers were very poor stock pickers. I’d call the performance of those actively managed funds “disastrous.”
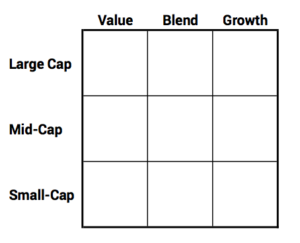
I counted the funds that failed to outperform their peer benchmark index. Each fund can be categorized to fall into one of these cells in the nine-box. Each cell has an index (Several companies construct indices like these.) and index fund. We can then used the peer index fund as the benchmark for performance.

I found that 34 of 44 or 77% of actively managed funds failed to beat their peer index. I also added up investors’ assets in these funds, and that also translated to 77% performing worse than their peer index. Wow. Basically three of four investors in Fidelity actively managed funds underperformed by two full percentage points for 2018. That’s biggly ugly.
==== Two popular funds underperform ====
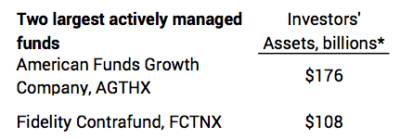
How did the two most popular, actively managed mutual funds in the US fare? These two, both in the Large Cap Growth category, are in the top ten of all mutual funds ranked by assets and are the flagship fund of their fund family. The other eight in the top ten are index funds. I really like that.

I get the following information from Morningstar* that compares performance of these funds to their peer Large Cap Growth index. I show the percentage point difference in performance to an ETF that mirrors the peer index that Morningstar uses. The ETF (IWF) performs at .2% below the index, basically its expense ratio.

With the exception of AGTHX over three years, both funds consistently lag the peer index fund. Over ten years, AGTHX lagged by about 1.4 percentage points per year and FCNTX by about .8 percentage point.
These percentage point differences seem small. This was THE segment of the market to be in for the past decade. On an absolute scale over a decade, an investor would have seen more than a three-fold increase in spending power of an initial investment from both these funds. You can bet that Fidelity and American Funds point that out.
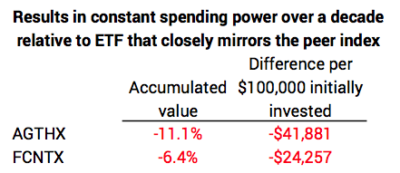
But I think its best to look at the relative performance to the peer index fund over a decade. On that basis AGTHX’s annual shortfall of 1.4 percentage points meant its accumulated value fell short of its peer index fund by 11%. That cost the investor more that $41,000 in spending power relative to a $100,000 initial investment. (This ignores the 5.75% front-end load or commission to purchase AGTHX; had I included that, AGTHX would have fallen short by 16% and would have costed the investor a whopping $61,000). FCNTX fell short by 6% and that cost the investor more than $24,000. You can bet that Fidelity and American Funds don’t point out these facts.

In fairness, both AGTHX and FCNTX had good performance, above their peer index, in the years 2003-2008. But that’s a long time in the past for me to think that kind of performance will be repeated.
Conclusion. More than 3/4s of actively managed funds at Fidelity failed to match their peer index fund in 2018. The average performance was two percentage points worse than the market as a whole.
The two most popular actively managed funds in the US failed to match their peer index fund in 2018. These two have trailed their index fairly consistently over a decade. Relative to holding an ETF that mirrors the peer index, an investor who put $100,000 into these two funds a decade ago “lost” as much as $60,000 in real spending power.
This post reinforces the message in Nest Egg Care. Stick with index funds. Switch now in your retirement accounts. You have no tax consequences to do so.
* The mobile site on my phone shows the comparison of a fund to its peer index. The site on my computer does not compare each fund to its peer index. I think Morningstar is in transition to correctly compare a fund to its peer index on the desktop site.