Are you using too low of Safe Spending Rate (SSR%)?
Posted on October 15, 2021

You probably are using too low of Safe Spending Rate (SSR%) for your calculation of your annual Safe Spending Amount (SSA). (See Chapter 2, Nest Egg Care (NEC).) My schedule of age-appropriate Safe Spending Rates (SSR%) is too low. (See Graph 2-7 and Appendix D, NEC. That means 1) you could pay yourself more than you’d calculate using the data and steps in NEC; or 2) you can take consolation that your plan is even safer than you thought; you have more years of guaranteed full withdrawal for your spending than you may have originally planned for. The purpose of this post it to explain how I conclude the age-appropriate SSR%s I display NEC are too low.
== Review: our plan and SSR% in late 2014 ==
Patti and I picked 19 years – her life expectancy then – as the number of years we wanted for ZERO CHANCE of depleting our portfolio. (See Chapters 2 and 3, NEC.) I put our inputs into my favorite Retirement Withdrawal Calculator (RWC), FIRECalc, as I describe in Chapter 2, NEC. I iterated the spending rate that gave me 19 years of full withdrawals for spending in the face of the Most Horrible sequence of returns ever. That was a spending rate of $44,000 per $1 million initial portfolio. I can run the same inputs in FIRECalc today and get the exact same result of 19 years. That’s not a surprise, since no sequence has supplanted the Most Horrible sequence from six years ago, the sequence of returns starting in 1969.
== What’s different now? ==
I assert I have a more accurate spreadsheet for that Most Horrible sequence than FIRECalc’s. The first four of these have a small cumulative effect; it’s the last factor below which I described in last week’s post that makes the significant difference.
• I use a better data source for real – inflation-adjusted – bond returns over time. FIRECalc’s default for bond returns in any year is “Long Interest Rate”, and that’s not the same as annual real return rates that I get from the most recent version from this source.
• I use the average of Long-term and Intermediate-bond returns for the sequence of bond returns. I think this is more representative of what an investor will own when he our she invests in bonds. Patti and I own a US Total bond fund – IUSB – which holds Short-term, Intermediate-term, and Long-term bonds – more than 13,000 of them.
• I lower the default input for investing cost to 0.10% from FIRECalc’s 0.18%. The 0.18% may have been appropriate for the expense ratio for index funds years ago, but fund costs are much lower now. For example, the total weighted expense ratio for Patti and me is about 0.05%
• Last week I showed the effect of a better withdrawal tactic than assumed in basically all RWCs: sell solely bonds when stocks crater and rebalance your portfolio in normal years to the resulting stock vs. bond mix – not back to your original design mix. In the example I showed, that tactic adds several years of safety to your financial retirement plan.
== 4.40% is 22 years of full withdrawals ==
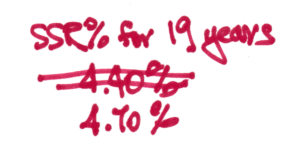
I use the same inputs to my plan in December 2014, and my spreadsheet shows that 4.40% SSR% gives 22 years of full withdrawals for spending, not 19. My original plan was safer than I had planned for! This is the spreadsheet.
== 19 years of full withdrawals is 4.70% ==
Our decision for 19 years of ZERO CHANCE to take a full withdrawal for spending was appropriate: in Chapter 4, I show the chance of 1) one of us being alive after 19 years and 2) riding along a Most Horrible sequence of returns that deplete a portfolio in a future year is about 1 chance in 50. (And that’s without taking corrective actions during retirement; we would know very early if we’re riding on a Horrible sequence.)
I iterate the constant dollar spending amount in my spreadsheet until I get to 19 years of full withdrawals. That’s 4.70% SSR%. That’s about 7% more ((4.7-4.4)/4.4) than I used to calculate our spending from our nest egg in our first spending year – 2015. This is the spreadsheet.
== What are the implications? ==
I could argue that I should revise the Graph 2-7 and the data Appendix D to reflect greater age-appropriate SSR%s. The line on Graph 2-7 would shift upward. But I don’t plan to make this argument. I don’t want to argue with the calculations in FIRECalc; I just conclude that FIRECalc errors by being too conservative. I have more confidence in using the current age-appropriate SSR%s in NEC; I have more confidence that WE AREN’T GOING TO RUN OUT OF MONEY!
Conclusion: I used the results from FIRECalc to calculate age-appropriate Safe Spending Rates (SSR%s) in Nest Egg Care. I now conclude those rates are conservative.
I built a spreadsheet that perform the exact same math as FIRECalc to the track portfolio value year-by-year for a given sequence of returns and set of inputs, such as spending rate, mix of stocks vs. bonds, and investing cost. I assert my improvements result in a more accurate tracking and understanding of the risk of failing to be able to take a full withdrawal for spending in a future year. I find that FIRECalc is pretty darn conservative. When I used FIRECalc for my plan inputs in late 2014, it told me I should use 4.40% SSR% to lock in 19 years of ZERO CHANCE of full withdrawals for our spending. (I would find the same 19 years with those same inputs today.) My more accurate spreadsheet says I should have used 4.70% – that’s about 7% more.