Are you holding up with the year-to-date decline?
Posted on March 11, 2022
Obviously, this is a stressful time. We’ve had two years of COVID that could have ruined our economy; inflation has not been this high for 40 years; and we have a war in Europe. I can’t make sense out of what it means for our retirement portfolio. Can you? This post describes what’s in my head about the recent decline that we’ve all seen.
My conclusion is that, so far, this decline is not extraordinary. I am emotionally detached. I can’t get worked up. I feel no urge to change my portfolio or sell securities earlier than my next scheduled sale for our spending, the first week in December. Even if I felt an urge, I would RESIST.
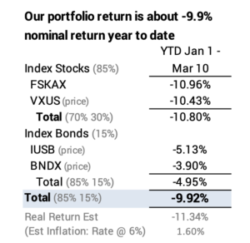
== Year to date: -9.9% ==
The decline year to date has been about 9.9%. That was as of Thursday; the market is down a bit so far today, Friday. Yes, this is a fairly steep decline. We’re in correction territory; we’re 10% below the peak in early January for stocks. Our brains extrapolate that 9.9% decline and automatically project that into the future: that projection can be disconcerting. (I get return data from the Morningstar site.)
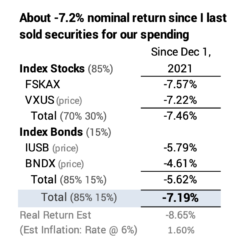
== My nominal decline: -7.2% ==
The 12-month period I use as the basis for calculating our Safe Spending Amount (Chapter 2, Nest Egg Care) runs December 1 – November 30. The market was up in December. My portfolio is down 7.2%.
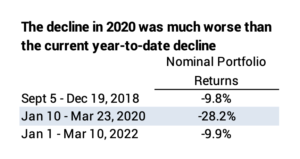
== Other recent declines ==
Patti and I have experienced two other periods of steep decline since the start of our plan on January 1, 2015. I calculate our portfolio decline for those periods. I tried to make the periods the same length; they’re at least close. The current decline (year to date) roughly matches the decline in 2018. The decline in 2020 was much steeper. I’m guessing all of us rode though those declines without panic – whether we were retired or not.
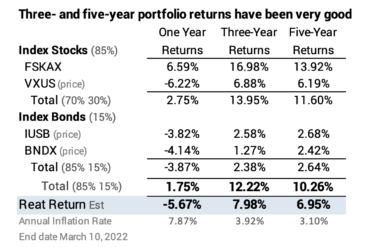
== Longer- term returns: good ==
I display the inflation-adjusted returns for our Investment Portfolio for one, three and five years. I should be very pleased about the three- and five -year returns; you should, too. Those return rates are greater than the expected real return rate I would expect on our portfolio: about 6.4% annual real return.
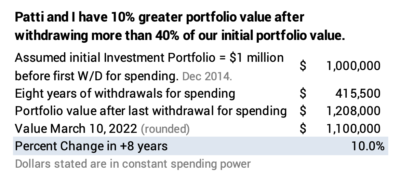
I can look back at our calculation sheet that I complete each December and see that today we have 10% more spending power in our portfolio than we did in December 2014, and that’s after withdrawing more than 40% of our original portfolio in +seven years. That makes it harder to get worked up about this decline. (See December post and the annotated calculation sheet.) If you weren’t making withdrawals like we did, you’re better off.
Conclusion. A portfolio of stocks and bonds has declined about 10% year to date. Is this a major concern? We don’t know how this is all going to shake out. We all can make a long list of uncertainties. I am not anxious, and I have no thoughts of changing my mix of stocks vs. bonds or selling earlier in the year for our spending than I would normally do: the first week next December.