The luck of the draw: building our nest egg and now spending it.
Posted on March 9, 2018
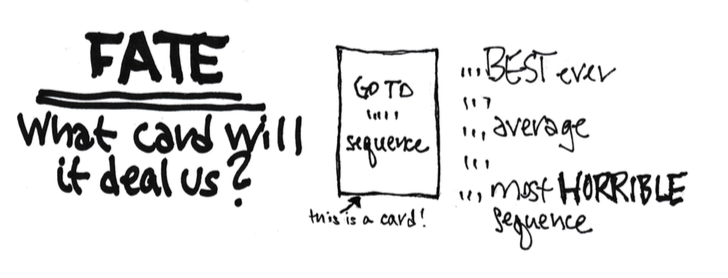
The purpose of this post is to describe how fate – the sequence of market returns we have faced and will face – affects our nest egg and spending in retirement.
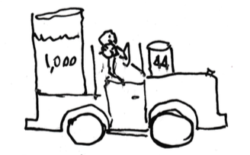
The luck of the draw – random chance – had a big effect on the size of our nest egg at the start of our plan. We all start our financial retirement plan with a snapshot of our nest egg – our financial balance sheet. That’s the fuel in our main tank right at the start of our retirement. At the end of each year we take out an amount and put it in our smaller feeder tank to our engine for our journey for the next 12 months. (Patti and I started taking out 4.4% at the start of our journey – 44 gallons per starting 1,000 gallons.)
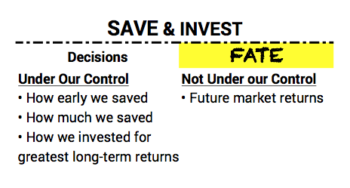
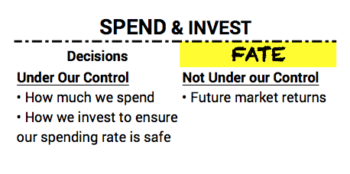
We retirees have spent decades to build fuel for that main tank. What led to its size clearly depended on two basic decisions under our control: 1) how we saved – how early we saved and therefore how many years we had compounding of returns working in our favor – and how much we saved; and 2) how we invested. The uncertainty not under our control – the card that fate would deal us – was the sequence of market returns we would ride along.
The best we could do was to make the right decisions to position ourselves to succeed for whatever returns fate might deal us. One thing we knew, or should have known, was that stocks would outperform anything else over the many, many years we had before we would spend any of our savings.
Fate dealt a terrific card in terms of stock returns for folks now age 65 or older – those of us who could have saved when we were in our late 20s or early 30s. That means we started saving and investing in the 1980s: that’s when 401k plans and IRAs really got their start, giving us all an incentive to save for retirement.
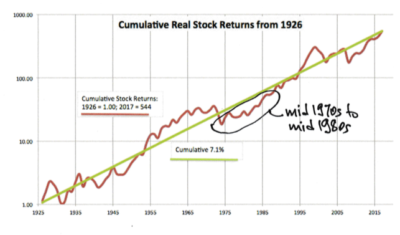
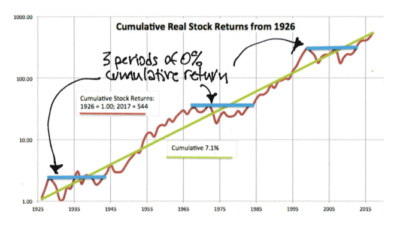
The returns for the years from the mid 1970s through the 1980s to today have been above the long run average real return for stocks. You get a clear picture of the return pattern over time on this semi-log plot of cumulative stock returns since 1926. (You can see and print a full display here. Oh, yes, that is a 544-fold increase since 1926; purchasing power from stocks doubles roughly every ten years; that’s about 9 doublings since 1926.) That red return line in the mid 1970s to mid 1980s is below the green long-term trend line; that means a line drawn from any of those years to the present is steeper than the green line – a slope greater than 7.1%*. We’ve all experienced above average return rates for our savings invested in stocks in those years. (This asssumes we very nearly nearly kept what the market has given to all investors; this was easy to do if we invested for low, low investing cost.) Those of us who were serious savers starting then are probably the richest set of retirees in history. (You can read the results from the $2,000 I invested in my IRA in 1981 and 1982.)
The luck of the draw – random chance – has a big effect as to how we retirees will fare in the future. How we will fare in the future has the same elements. We make key decisions on what we can control: 1) how much we spend and 2) how we invest to ensure our spending rate is safe. The uncertainty not under our control – the card that fate will deal us – is again the sequence of market returns we will ride along.
We Nest Eggers have made the right decisions to put ourselves in the best position to succeed for whatever returns fate might deal us. We did that when we completed our worksheet of key decisions Nest Egg Care. The key planning trick we employed was to always assume we are going to ride along one of the sequences of return that resulted in essentially 0% cumulative return from stocks over many years. That assumption always drives our Safe Spending Rate (SSR%) to a low level. On this graph below I’ve highlighted the three long periods of zero percent cumulative returns from stocks. The shortest is 13 years.
• 1930 to 1943 (13 years)
• 1966 to 1983 (17 years)
• 2000 to 2013 (13 years)
In a previous post, I described how we Nest Eggers think about and live our retirement. Here’s a summary of part of what we do.
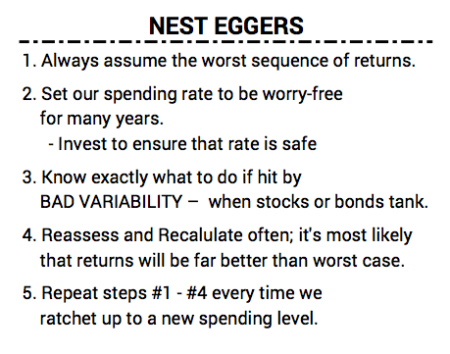
Conclusion. Fate will deal us a sequence of future financial returns that can range from the best in history to the worst. The best we can do as retirees is to make decisions that put us in the best position to succeed for whatever returns fate might deal. You have made the right decisions when you’ve completed your planning worksheet in Nest Egg Care.
* I state the real return for stocks as 6.4% in Nest Egg Care. That was data through 2012 as stated in Stocks for the Long Run by Jeremy Siegel. The compound return rate will slightly vary year by year when one calculates that rate from 1926 to a specific end point.