How does the IRS calculate your RMD percentage?
Posted on July 29, 2022
The IRS publishes a “Uniform Life Expectancy” table to use for the calculation of Required Minimum Distributions (RMDs) from your traditional IRAs. The inverse of the years shown for your age is your RMD percentage. That table applies to all us while we are alive, and the table will apply to my IRA that Patti inherits on my death. The number of years in the table differs widely from a person’s life expectancy – mine from the table is more than double my life expectancy. Why is the difference so great? The purpose of this post is to describe how the IRS calculates your age-appropriate RMD percentage. I also describe that your RMD typically is much less than your annual Safe Spending Amount (SSA) that I calculate in Nest Egg Care (NEC) Chapter 2.
== Uniform Life Expectancy and your RMD percent ==
The IRS displays a “Uniform Lifetime Expectancy” for each age. The number of years for each age is also called the Distribution Period, and the inverse is your RMD percentage. See Appendix B, Table III here. All of us – married or not – will always use the age-appropriate Distribution Period – years – from the Uniform Lifetime Expectancy table to find our RMD percentage.
• Patti and I must use the age-appropriate Distribution Period from the “Uniform Lifetime Expectancy” table to determine our RMDs from our traditional IRAs.
• Upon my death, Patti will either rollover my IRA that she inherits into hers or keep my IRA in a separate account but elect to apply her age-appropriate Distribution Period for RMDs. (Rules are different if you inherit an IRA from someone other than your spouse.)
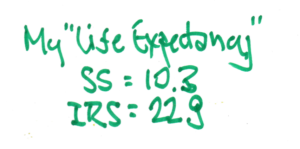
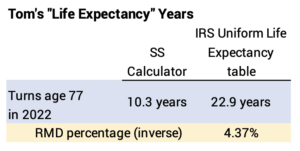
The years for my age in the Uniform Life Expectancy are more than double my life expectancy that I find from the Social Security Life Expectancy Calculator. Why is this?
== Calculating “Uniform Life Expectancy” ==
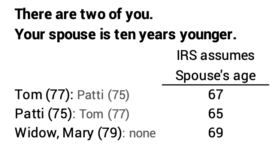
The IRS is calculating a life expectancy that is based on the assumption that there are two of you: you and your spouse who is ten years younger. The years calculated are roughly* the number of years for 50% probability for At Least One of You Being Alive. (A separate table applies if your spouse is more than ten years younger than you.) [*The IRS calculation is not quite as simple as the calculation of At Least One Alive that I describe in Chapter 3, NEC; this document explains the exact calculation, which is too hairy for me to understand.]
I turned 77 in 2022; the IRS assumes my spouse (Patti) will turn 67 in 2022. Patti will turn 75 in 2022; the IRS assumes her spouse (Tom) will turn 65 in 2022. My friend, Mary, is a widow, age 79; the IRS assumes she has a spouse age 69.
== Individual life expectancy ==
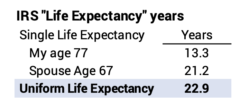
The IRS displays life expectancy for individuals in its Single Life Expectancy table. See Table 1, here. The IRS uses an average of the life expectancy for males and females. The table shows the life expectancy for a person who turns 77 in this year, is 13.3 years. This is about two years more years than I would get using Social Security’s Life Expectancy Calculator; I do not know why they differ.
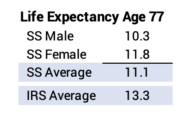
The probability of At Least One Alive is always more years than the life expectancy of the one with the longest life expectancy. I explain this in more detail in Chapter 3 and Appendix E, NEC. The IRS’s life expectancy for a spouse ten years young than me is 21.2 years, but the number of years that is close to the point of 50% chance of At Least One Alive is 22.9 years.
As I read it, the IRS makes no underlying assumption about future return rates, but I would think the IRS is confident that their table of age appropriate RMD percentages ensures that a retiree does not run out of money in their life time. I think the objective is for the RMD percentages to be great enough for your spending to enjoy retirement, but not so high to run a chance of having too little RMD dollars from a seriously depleted portfolio.
== Nest Egg Care: SSR% ==
Nest Egg Care calculates a Safe Spending (or Withdrawal) Rate (SSR%) that eliminates the “return-sequence risk” in your financial retirement plan. NEC assumes that you are just starting to ride or have been riding along THE Most Harmful sequence of stock and bond returns in history and finds the spending rate that has Zero Chance of depleting for the number of years you pick.
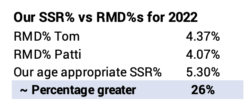
Patti and I picked her life expectancy as the number of years we wanted for Zero Chance of depleting our portfolio throughout our plan. As we age, that number of years declines: her life expectancy was 19 years in late 2014, and at the end of this year her life expectancy is 13 years using the SS calculator. Our age-appropriate SSR% has increased, as have our RMD percentages.
Our age appropriate SSR% that I will test on for my calculation the first week of December is based on Patti’s 13-year life expectancy: 5.30% (See here and Graph 2-4 and Appendix D, NEC.). That’s roughly 26% greater than the average our RMD percentages.
== RMD% could ~equal your SSR% ==
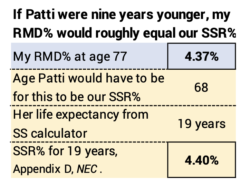
It turns out, by accident I think, that if your spouse is ~ten years younger, your SSR% is close to your RMD%. My RMD percent is 4.37%. Our SSR% is based on Patti’s life expectancy. If she was 69 – nine years younger than me – her life expectancy would be 19 years and that equals SSR% of 4.40%. See Appendix D, NEC. (My example may be a total coincidence; I’ll play with this in a future post.)
== $RMD << $SSA ==
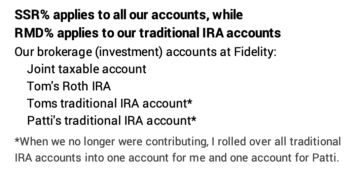
I think you get this: the dollars you withdraw from your traditional IRA will be much lower than the dollars you withdraw from your nest egg as your annual Safe Spending Amount using your SSR%. RMD% is applied to your traditional IRAs, while your SSR% is applied to the total dollars in all your Investment Portfolio: your taxable account; your Roth IRA accounts; and your traditional IRA accounts.
Conclusion. The IRS calculates a Required Minimum Distribution (RMD) percentage that you must withdraw from your traditional IRAs each year. The percentage is the inverse of a Distribution Period (years) that the IRS displays in a table, “Uniform Life Expectancy.” The years displayed in the table are many more than your life expectancy that you can find on the Social Security Life Expectancy Calculator. That’s because the IRS always assumes you are couple and your spouse is ten years younger than you, and it’s calculation is based on the chances of “At Least One Alive”.
For many of us, the RMD% is significantly lower that the Safe Spending Rate (SSR%) that one finds in Nest Egg Care. Our Safe Spending Amount using our SSR% is always much greater than the dollars of RMD: we nest eggers apply our SSR% to our total Investment Portfolio, while the IRS requires us to apply the RMD% only to our traditional IRA accounts.