How closely do Index Funds mirror the US index they attempt to mimic?
Posted on September 8, 2023

Ideally, before costs, index funds exactly match the index they attempt to mimic. Returns for shareholders of the fund should be the returns for the index less the fund’s expense ratio. This doesn’t always hold true because of tracking errors – the funds inability to exactly match the performance of the index before costs. This post shows the tracking errors are VERY SMALL for index funds that try to mimic to broad indices of US stocks. A surprise to me: several funds offset all of their expense ratio and return more than the market index returns to fund shareholders.
I conclude that any of these index funds in this post are terrific investments whether they are perfect in tracking their index or not. They all return +99.4% of their benchmark index to their shareholders. The difference in the dollar returns between the index funds is small – at most on the order of $5 per year per $10,000.
The +99.4% returned to investors should be compared to about 91% returns to shareholders from actively managed funds. That 91% is the result of the average expense ratio of about 0.66% for the average actively managed funds.
== S&P 500 index funds ==
I recommend you hold a US Total Market index fund. But S&P 500 funds are the most popular index funds. The S&P 500 index accounts for about 85% of the value of all stocks. Over the past decade or so, S&P 500 stocks have outperformed the remaining 15% of the market – the remaining 3,600 or so mid and small cap stocks. That trend will likely change in time.
S&P 500 index funds come VERY CLOSE to the simple math of Shareholder Return = Index Return less the funds Expense Ratio. A fund’s expense ratio is its administrative, operating and management expenses charged as a percentage of the fund’s average assets under management. A fund’s trading or transaction fees are not included in fund’s expense ratio. You can view the fund’s expense ratio as a direct deduction of the fund’s annual return before costs; the fund’s trading fees would add to the deduction.
The expense ratio for the S&P funds I looked at range from a low of 0.015% to a high of 0.04%. Using 7.1% as the long run average or expected return for stocks, that roughly means all these funds should – and do – return more than 99.4% of the index return to shareholders.
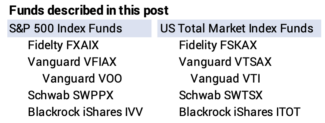
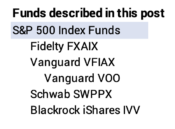
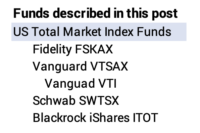
I show the performance of five S&P 500 index funds: Fidelity’s FXAIX; Vanguard’s VFAIX and its sister ETF, VOO; Schwab’s SWPPX; and Blackrock’s iShares ETF IVV.
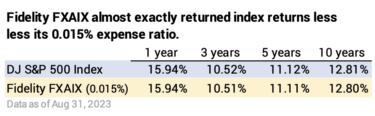
• FXAIX has the lowest expense ratio (0.015%). It consistently returns to shareholders the index return less 0.10%. That’s the lowest net reduction from the index and the highest net return to shareholders of the five.
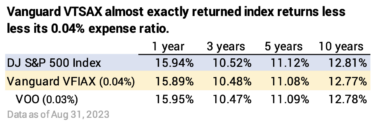
• Vanguard’s 500 fund VFIAX is the first index fund, formed in 1976. Its expense ratio is 0.04%. Returns are fairly consistently 0.04% less than the index. VFIAX also accurately tracks the index before consideration of costs, and returns about 0.03% less than FXAIX – the difference in their expense ratios. The sister ETF from Vanguard, VOO, is 0.01% lower expense ratio. The price of VOO over time reflects this lower expense, and it returns roughly 0.01% more than VFAIX over time.
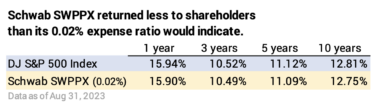
• Schwab’s SWPPX has an expense ratio of 0.02% that almost matches that of FXAIX and is half that of VFIAX. Its returns to shareholders are about the same Vanguard’s VFIAX. The fund, before costs, is not tracking the S&P 500 as precisely as the other two.
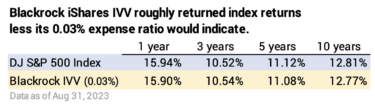
• Blackrock’s iShares ETF IVV has an expense ratio of 0.03%. The returns to shareholders fairly consistently track the index less 0.03%.
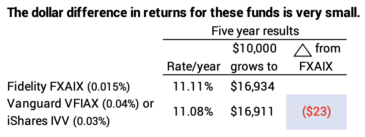
The differences in dollar return from these funds is small – on the order of $5 per year per $10,000 invested.
== US Total Market funds ==
Patti and I own a US Total Market fund as our only US stock market fund. I recommend the same kind of fund for your US stocks.
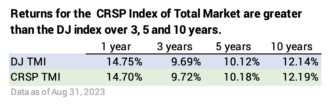
The data below shows that Vanguard Funds return more to shareholders than the other funds. The reason for the difference in return isn’t from tracking errors. All but Vanguard in my sample use Dow Jones S&P Total Market Index (DJ-TMI) as their benchmark. Vanguard uses the Center for Research on Security Prices Total Market Index (CRSP-TMI) as its benchmark. The returns for CRSP-TMI are greater than that for DJ-TMI over three, five, and ten years. I have no explanation as to why or if this will continue in the future.
• The four that aim at the DJ-TMI generally return more than the benchmark index over five and ten years. Before costs, they earn more than the index. FSKAX has consistently returned more than the index. Funds lend securities to shortsellers and generate income that offsets their expense ratio. I think all these funds invest a portion of their assets in derivatives – options – try to help returns, and FSKAX may have consistently done a good job.
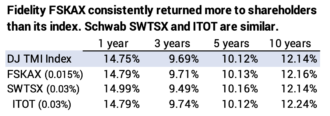
All three own fewer stocks than the total in the index. FSKAX owns 95% of the total of 4,150 stocks in the DJ index. ITOT owns 78%. The sampling method used for the stocks not owned may also be a source of the outperformance.
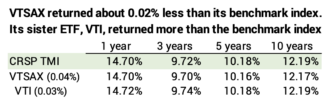
• Vanguard’s VTSAX returns about 0.02% less than the CRSP Index relative to its 0.04% expense ratio. It, too, performs better than the index before costs. I show the sister ETF for this fund, VTI, that has 0.03% expense ratio. It performs about 0.02% better in return per year than VTSAX and has returned the benchmark index.
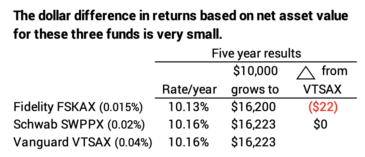
The differences in dollar return from all these funds is small – also on the order of $5 per year per $10,000 invested.
Conclusion: Ideally the return for shareholders for an index fund is the return for index less the expense ratio for the fund. This is almost exactly true for all index funds that track the S&P 500. The most consistent in my sample is Fidelity’s FXAIX which fairly consistently returns 0.01% less than the S&P 500 index returns.
It’s a bit harder to compare funds for US Total Stock funds, since funds don’t use the same index for the benchmark. Vanguard uses a benchmark index that has had greater returns than the benchmark used by other funds in my sample. The Vanguard fund VTSAX and ETF VTI have provided the greatest return to investors.
All these funds return +99.4% of the index return to their shareholders. Some manage to return more than the index return to their shareholders. The dollar difference in returns to shareholders for these funds are in the range of $5 per year per $10,000 invested. I conclude any of these funds is a terrific investment.