How bad was the August inflation report?
Posted on September 16, 2022

The headline from the BLS press release on Tuesday said inflation was +0.10% in August. That’s an annual rate of 1.2%, and the stock market immediately fell by over 4%. This confused me. What gives? What gives is differences in the broadly used measure of inflation called CPI-U, the seasonally adjusted CPI-U, and Core Inflation. Core Inflation, which increased sharply from the prior month, is the culprit in the story. The purpose of this post it to explain the differences in measures of inflation.
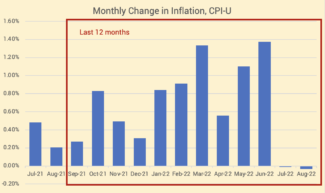
== CPI-U: -0.04% for August ==
The inflation number that is most widely used is CPI-U, the Consumer Price Index for All Urban Consumers. This is reported each month roughly two weeks after month-end. This is the table for CPI-U. (The table also contains CPI-W, which is what Social Security uses to calculate its annual Cost of Living Adjustment.) CPI-U decreased by 0.04% in August: that’s deflation. This August-result replaced the prior August, which was greater inflation. The cumulative value of the last 12 months was 8.26% inflation, less than the prior 12 months of 8.52% inflation.
== CPI-U seasonally adjusted: +0.10% for August ==
The BLS seasonally adjusts the price changes for price patterns to more accurately reflect monthly changes; adjustments smooth patterns due to seasonal weather or for buying around major holidays, for example. The pattern for these monthly changes is slightly different than those of unadjusted CPI-U, and is the reason for the headline that inflation increased by 0.10% in August.
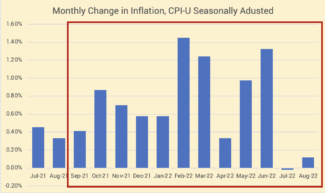
Over a year, the unadjusted and adjusted inflation rates are almost identical.
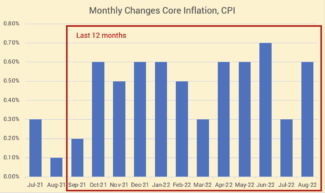
== Core Inflation: +0.6% for August ==
Core inflation removes two volatile measures from the seasonally adjusted CPI-U: price changes in energy and in food. This graph shows that the annual changes in Core inflation is less volatile. The BLS press release states the August change in Core inflation was +0.6%, an annual rate of more than 7%. I could not find a table from BLS for these changes. This site has compiled the monthly changes that BLS reports. It shows that the 0.6% increase was twice that forecasted by economists. One could not conclude that Core inflation is declining.
I summarize the three monthly-changes for August and the results for the prior 12 months. Monthly inflation for all the things we buy is low, but Core inflation – everything other than energy and food – remains high. Thus, the wrenching decline in stocks.
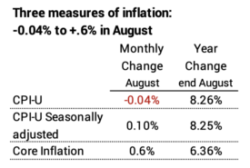
Conclusion. I was surprised that the stock market reacted so negatively on Tuesday to this month’s report on inflation. I looked at the broadly used measure, CPI-U, which declined in July and again in August: that’s two months of deflation. The culprit in the story is the measure of Core inflation, which does not include the more volatile energy and food components of CPI. Core inflation in August increased 0.6%, close to the rate of a number of prior months, and one does not perceive a pattern that is says it is on track to decline.