Are you lured by AAII’s claim that you can make three times more in the stock market?
Posted on September 15, 2023
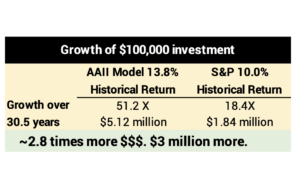
I was a member of AAII a number of years ago, but dropped my subscription. This week I got a slick packet enticing me to join that says, “AAII Members Make Nearly 3 Times More Profit than Most in the Stock Market.” “Join 150,000+ AAII members in outperforming the market!” “AAII Beats the Market!” The evidence: over the last 30.5 years an investment in the AAII Shadow Stock Portfolio grew 51 times compared to 18 times for an S&P index fund: you’d have +$3 million more relative to an initial $100,000 investment. AAII says they are your “guide to consistently beating the market.” This post tells you: don’t be lured. The Model has WILDLY outperformed in the distant past and BADLY underperformed in the recent past. Do not pay the money to follow the AAII Model. You will most reliably be FAR BETTER OFF by sticking with a stock index fund.
== Don’t be lured: stick with Index Funds ==
Yes, the AAII Model far outdistanced an SP 500 index fund over the past 30.5 years. But was it from “consistently beating the market?” NO. NOT CLOSE. I’d guess the Model would rank as almost the WORST performing stock mutual fund over the past five and ten years.
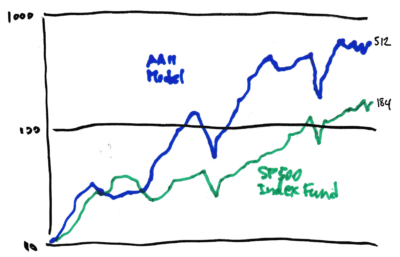
You can see the graph of the results of the AAII Model vs. two index funds here. I’ll focus on the Model vs. the SP 500 index fund. I spent the time this week doing my best to read the semi-log graph display. I printed the graph and annotated it here.
• The Model had one six-year period that spells the complete difference in the two end points. The model results soared relative to the SP 500 index fund fore six years from 2002 through 2007. Returns for the nine years to 2002 and the 15.5 years from 2008 have been the same.
From 1993 to 2002, the Model and the SP 500 index fund had the same cumulative return: the two lines touch in 2002. Then the two lines depart. The slope of the line for the Model is much steeper than that for the SP 500 fund; steeper up is greater return; the distance between the two lines is growing; the Model’s cumulative return is more than the SP 500 index fund.
From 2007 to the present the model and the SP 500 index fund have had the exact same results. I can tell that by looking at the distance between the two lines starting in 2008 and the distance between the two today. It’s 2.4 cm at both points. If the lines are the same distance apart at two points in time, the returns are the same.
I can describe this differently. I could draw a line connecting the point for 2008 to the present for each line. The lines would be parallel. Therefore, the return rates over that period were the same and the total returns were the same.
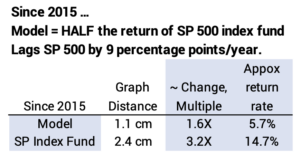
• The Model has underperformed the SP 500 index fund by about HALF since 2015. I calculate that as underperforming by an average of nine percentage points per year. If the Model were a mutual fund, I think it would rank as perhaps the WORST of all stock mutual funds.
The Model had another sharp rise from 2008 through 2014: that steeper upward climb for the Model increased the distance between the two. But since 2015, the distance narrowed.
I can measure the vertical change in distance from 2015 to the present. That distance translates to a growth multiple: a doubling of return = 1.5 cm on my graph. The change in distance for the Model from 2015 to the present is 1.1 cm; that translates to 1.6 times total return or 5.7% per year. The change for the SP 500 index fund from 2015 to the present is 2.4 cm; that translates to 3.2 times total return or 14.7% per year.
== Problem: No independent verification ==
I find no independent verification of the AAII model. The Hulbert Financial Digest has tracked the performance of many portfolio models and stock picking newsletters for over 30 years. Hulbert measures performance by determining the price a subscriber would really pay to buy and get to sell. Results were not nearly as good as the data provided by the newsletter.
The problem was that a newsletter would issue a Buy signal, and subscribers would buy that day or the next, but the trading volume drove up the price. Almost no one obtained the price the newsletter used for its tracking of performance at both Buy and Sell signals. The methodology that Hulbert uses corrects for these potential distortions. He used the prices a subscriber would get. See “Methodology” under “Performance Scoreboards” on his web site.
The AAII Model likely suffers from the same effect. Why haven’t they subjected this model to Hulbert’s independent analysis?
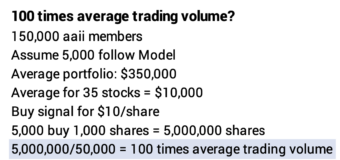
I can see a partial list of the 35 stocks in the Model here. I look the few up on MarketWatch. I’m guessing that they have an average market capitalization of $100 million: this is a portfolio of micro-cap stocks. I see the typical trading volume might be 50,000 shares in a day.
I can imagine that AAII posts a Buy signal for a company at $10 per share (That’s likely what they use as the acquired price for the Model.). But those following the model can’t buy at $10 because the trading volume that day might be extraordinary and drive up the price. It would be the opposite effect on a Sell signal.
Conclusion: Rising to be in the top ranks of all investors is pretty easy. Stick with index funds. Over time, 15 of 16 actively managed funds fail to match the performance of their peer index funds. I think NO portfolio model of individual stocks from a stock-picking newsletter reliably outperforms an index fund.
The AAII Shadow Portfolio has outperformed over the past 30 years. It soared mightily for a six-year period 2002 through 2007. It did not outperform before 2008, and it did not outperform from 2008 to the present. It has badly underperformed recently: the cumulative return for the Model is roughly HALF that of an SP 500 index fund since 2015. It lags by about nine percentage points per year. The Model is not a mutual fund, but I think it would rank at the VERY BOTTOM if it were.
Don’t buy into the claim that 150,000+ “AAII Members Make Nearly 3 Time More Profit that Most in the Stock Market? Don’t think you will do better than an index fund by following AAII’s recommended Shadow Stock Model.