Why don’t we have a precise record of historical stock returns?
Posted on February 25, 2022

I spent time this week trying to understand the historical record of stock and bond returns. I mentioned last week that FIRECalc uses one source for stock and bond returns (Shiller) while I’ve used another for my spreadsheet calculations (Ibbotson). I looked at the detail of three sources of historical returns for stocks and bonds. I was surprised to find no year that the three report the same annual total return for S&P 500 stocks; two of the three report real returns for for 10-year US Treasury bonds, considered as long-term bonds. This post describes the differences in reported historical returns and the implications for our calculation of Safe Spending Rate (SSR%) that I discussed last week.
The bottom line is that the differences don’t really affect our calculations of Safe Spending Rate (SSR%). The SSR%s that you get from FIRECalc – that I display on Graph 2-7 and in Appendix D in Nest Egg Care – are from the data source that has the most conservative – worst – returns for stocks for THE Most Harmful Sequence that starts in 1969: that means the calculation for Safe Spending Rate (SSR%) will therefore be lower – more conservative.
== Three providers of historical returns ==
I find three publicly accessible sources of historical returns. Ibbotson (data from 1926), Shiller (data from 1871), and Stern/NYU (data from 1928). All three provide real – inflation-adjusted – returns for S&P 500 stocks. Two provide data for 10-year and one for 20-years US Treasury bond; both are considered as long-term bonds.
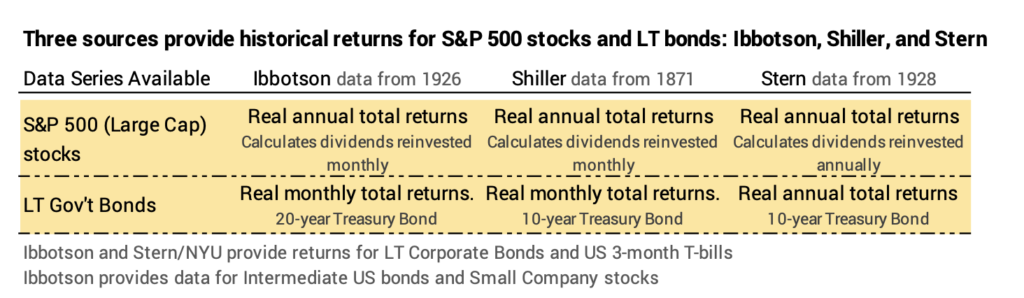
All three follow the same procedures to find annual total returns for S&P 500 stocks: they assume reinvestment of dividends and account for the change in price of the S&P 500 stocks; they then adjust total return for the year for inflation. For bonds, they also reinvest interest and calculate the impact that a change in interest rate has on bond price: bond prices predictably move opposite to the direction of change in interest rates; they similarly adjust total return for inflation.

We have a published record of monthly inflation from 1913 (accessible here), so the math to translate nominal returns to real returns is straight forward from 1913; Shiller had to reconstruct the inflation index for the years prior.
== The three don’t precisely agree: stocks ==
The S&P 500 index as we know it today was first published in 1957. The S&P Composite index started in 1923 with 90 stocks and expanded to 500 by 1957. In 1957 the S&P 500 stocks were about 90% of the total market value of all stocks; they are about 80% of the total value of all stocks today.
Returns prior to 1957 must be reconstructed, and I could understand that the three could be different for those years. I would think the three would provide the exact same returns since 1957, but there is no year that all three report the same return rate for S&P 500 stocks. None of the three report the same return from the nominal returns published on S&P’s web site for the past ten years. (You can download a fact sheet.)
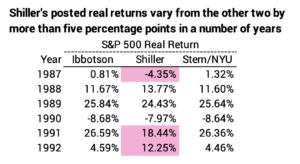
Shiller in particular seems to waver the most. I find a number of years where Shiller varies in return by more than five percentage points from at least one of the other two.
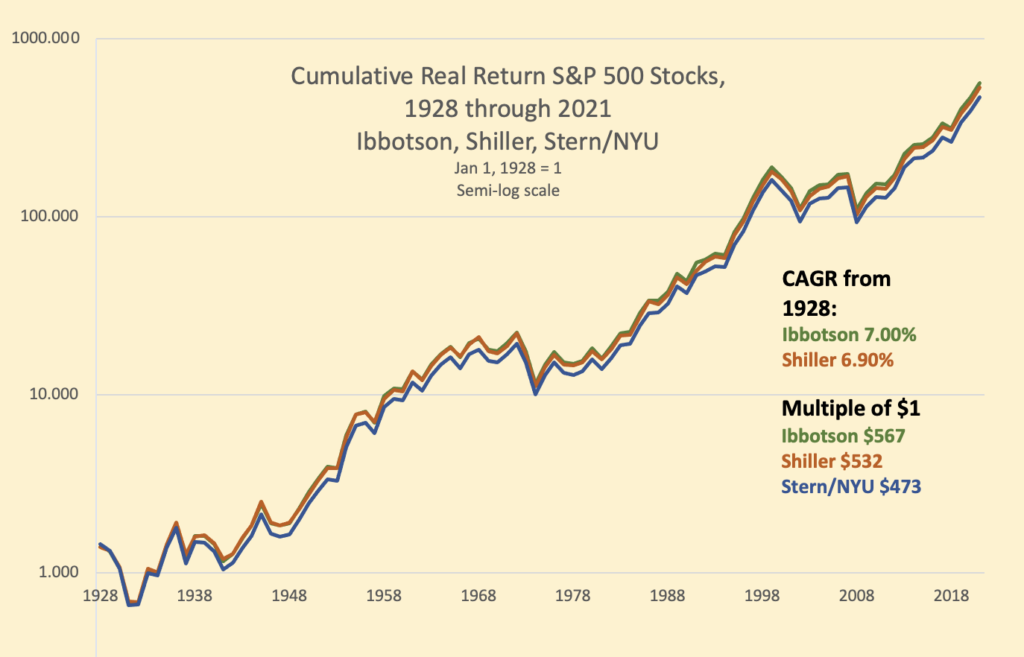
Cumulatively since 1928, Ibbotson and Shiller are very close in result. Stern/NYU trails in compound average growth rate (CAGR) by about 0.2 percentage points per year. That cumulates to a fairly large difference.
== It’s the 1969 sequence that’s important ==
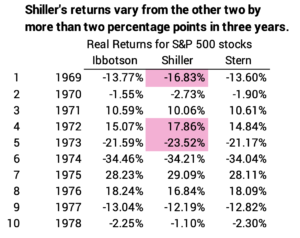
I want to focus on the sequence that starts in 1969. This is THE Most Harmful Sequence of returns that drives our Safe Spending Rate (SSR%) to a low level. This sequence is most harmful to portfolio value for all periods greater than ten years and leads to the earliest potential depletion for a given spending rate.
The three vary in returns for both stocks and bonds for this sequence, but the implication is clear. FIRECalc uses the Shiller data which is lower in returns for S&P 500 stocks for this sequence. It’s cumulatively three percentage points lower for the first six years – the steepest six-year decline for stocks in since 1871 – and that difference is enough to result in lower portfolio value over all subsequent years as compared to the other two. Shiller’s returns result in lower SSR%.

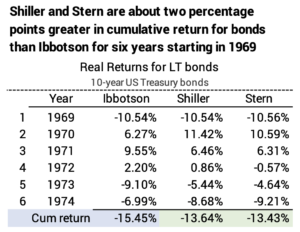
Shiller’s cumulative return for LT 10-year bonds is ~2 percentage points better than Ibbotson’s returns fore LT 20-year bonds for those six years. That’s to be expected since long term bonds are more affected by changes in interest rates, and this was a period of high and increasing inflation. But that two point better result does not offset the ~3 points worse for stocks in the calculations of SSR% at what I consider to be the proper range of stock mix: 75% to 85%.
(Note: On its Your Portfolio page, FIRECalc calls its default input for fixed income as “Long Interest Rate”. That’s befuddled me for years. It’s really Shiller’s measure of real annual returns for 10-year US Treasury bonds.)

My spreadsheet calculations using Ibbotson’s returns found that FIRECalc was a shade conservative (see here). I understand why more clearly.
Conclusion: I examine the history of total real returns for S&P 500 stocks and long-term bonds in this post. I find three sources of historical data: Ibbotson, Shiller, and Stern/NYU. I would think the three would have nearly identical records of annual returns for stocks, particularly after 1957 when the index as we know it today was first published. The three report a slightly different return each year. Shiller seems to vary more from the other two. Cumulatively from 1928, Ibbotson and Shiller nearly agree in cumulative return while Stern/NYU trails.
Returns for the harmful sequence that starts in 1969 are important: that’s THE Most Harmful that sequence leads to earliest potential depletion of a portfolio and therefore our Safe Spending Rate. The Shiller sequence for stocks leads to a steeper decline of a portfolio with what I consider to be a proper mix of stocks: range of 75% to 85%. FIRECalc uses Shiller returns for its calculations, and therefore FIRECalc’s year-by-year portfolio values will be lower – yielding a more conservative SSR%.