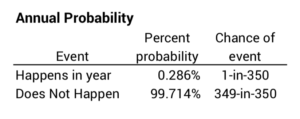
How many bad 1-in-350 financial events are in your retirement plan?
Posted on October 11, 2019
We retirees want to lock in a number of years for NO CHANCE of depleting our portfolio. A key decision – our Safe Spending Rate (SSR%) – assumes we will face the most horrible sequence of financial returns in history. We nesteggers use the actual Most Horrible Sequence starting in 1969: I’m almost certain that’s the most horrible sequence that all of us would use following the steps in Nest Egg Care (NEC). That means we nesteggers assume we will hit two extraordinarily remote bad financial events within the first five years of our retirement plan. But only one exceeds 1-in-350 years probable: one is a 1-in-185-year chance event; the other is a 1-in-2400-year chance event. The purpose of this post is to explain those statistical probabilities.
== How would you answer this question? ==
My friend David officially retired at the end of August. He recently asked, “Aren’t you worried about a recession and what it means for stock returns?” Here’s the answer I’d give David today.
“NO! We spend a safe amount from our next egg each year that means we have NO CHANCE of depleting our portfolio through 2035. I may be in diapers then!
“Our spending level is safe, because it’s based on the assumption we’ll face the Most Horrible Sequence of stock and bond returns in history. Starting tomorrow.
“And it won’t be as bad as we’ve assumed because the Most Horrible Sequence is truly Most Horrible: stocks decline by 48% in two years. Bonds decline by more than 60% over a ten-year stretch. Those approach statistically impossible events – one is more than a 1-in-2400-year event.”
== Bombs devastate a portfolio ==
What kills our portfolio – what leads to far lower portfolio value over time – are bombs of back-to-back years of negative stock and bond returns. The bombs evaporate huge chunks of our portfolio. We can work through bombs in our earlier Save and Invest phase of life; time is on our side. But we retirees don’t have the luxury of waiting years for the rebound. We’re withdrawing from our portfolio each year making the bomb crater even bigger. Once the crater is big enough, no pattern of good returns can refill it. Our portfolio spirals down to the point where we can’t keep taking our planned annual withdrawal for spending.
== What’s the Most Horrible Sequence? ==
The Most Horrible Sequence of returns that I found for Patti and me started in 1969, and I think that’s the Most Horrible sequence for your plan. No mix of stocks and bonds will do well over this time period.
Our Retirement Withdrawal Calculator (RWC) used that 1969 sequence to show that our Safe Spending Rate (SSR%) at the start of our plan was 4.40%: if Patti and I spend at $44,000 constant spending power per $1 million initial investment portfolio, we know we can take a full withdrawal for spending for 19 years. That’s the number of years Patti and I picked. It was just 13% probable that both of us would be alive then. (See Chapters 2 and 3, NEC.)
== Details of that Most Horrible Sequence ==
I discussed this sequence here, but here is a fresh recap:
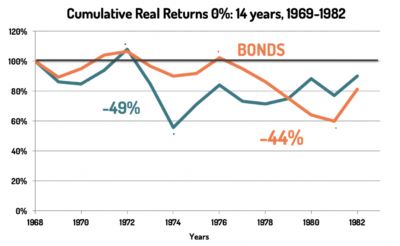
• Cumulative stock returns were -10% for 14 years. This is one of three long periods cumulative stock returns below 0% since 1926: the other two started in 1929 and in 2000.
This sequence kicks off with the largest six-year decline in stocks in history – 10 percentage points worse decline than the second worst sequence. Those six years contain a stock bomb: in 1973 and 1974 stocks declined -49% in spending power. This is the second worst two-year decline in history. (The worst is 1931 and 1932.)
• Cumulative bond returns were -19% for 14 years. This is part of the long, 45-year period of 0% cumulative return starting in 1940.
The whole sequence for bonds starting in 1969 is horrible but the real bomb is the one that also exploded in 1977: bonds decline in real spending power by 44% over the next five years. This is an average return of -11% per year. We tend to think that bonds are stable ballast for our portfolio, and they are excellent insurance when stocks tank, but this ballast is sinking the ship, not righting it.
== Economic events during that sequence ==
I think we know that the return actual return patterns for stocks and bonds are driven by economic events. Here are economic events that shaped the Most Horrible Sequence staring in 1969:
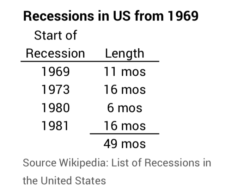
• Recessions. 1969 was the start of a recession. The economy was in recession for almost half the first five years. We had a total of four recessions in 14 years. We’ve never had that many recessions or months of recession over a 14-year period.
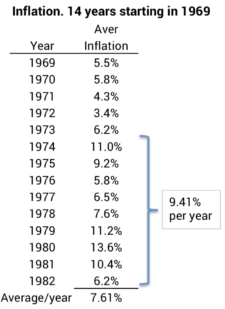
• Inflation. Inflation was over 5% in 1969 – up from less than 2% per year for the 15 years ending in 1965. It increased to 11% by 1974 and then to more than 13% by 1980. As interest rates rise from inflation, bond prices crater. That’s the primary cause of the steep fall in bond returns
== Applying statistics to two bombs ==
Financial folks love statistics. I like statistics, too, but the implicit assumption with statistics is that the data points – annual stock or bond returns in this case – are independent events. I think we can agree that year-to-year stock and bond returns are not independent or random events. I assert that statistics would not reasonably predict the two bombs for stocks and bonds in one 14-year sequence of returns. The real world is worse than the statistical world.
But we may gain some insight by looking at the statistical chance of these bombs hitting us. I describe the steps to do these calculations here. Here are the conclusions:
1. Statistics would tell us the stock decline of 48.6% in 1973 and 1974 is .54% probable. (It’s 99.46% probable that we won’t see returns like that – starting now.) We could describe the chance of being hit with a two-year decline like that as a 1-in-185-year chance.
2. Statistics would tell us the bond decline of 44% over five years is a bit more than .04% probable. (It’s 99.96% probable that we won’t start on a sequence like that.) We could describe chance of being hit with a five-year decline like that as more than 1-in-2400-year chance.
Conclusions: We use the Most Horrible Sequence of stock and bond returns for our retirement planning decisions. Following the process in Nest Egg Care means the Most Horrible actual sequence of stock and bond returns start in 1969. If you like statistics, that sequence has two relatively short periods of returns that are extremely low probability: 1) a two-year negative stock return of -49% is a 1-in-185 year chance; and 2) a five-year negative bond return of -44% is a 1-in-2,400 year chance.