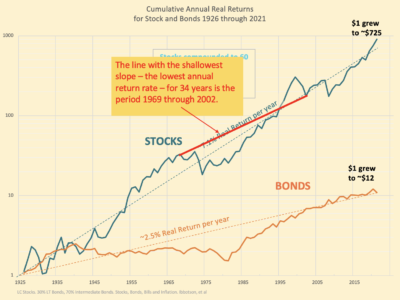
A straight line on this semi-log graph is an annual return rate. The shallower the slope, the lower the return rate. The 34-year line with the shallowest slope for stocks is the red line from 1969 though 2002. The 34-year line that starts one year earlier or one year later is more than one percentage point greater in return.